Free Access
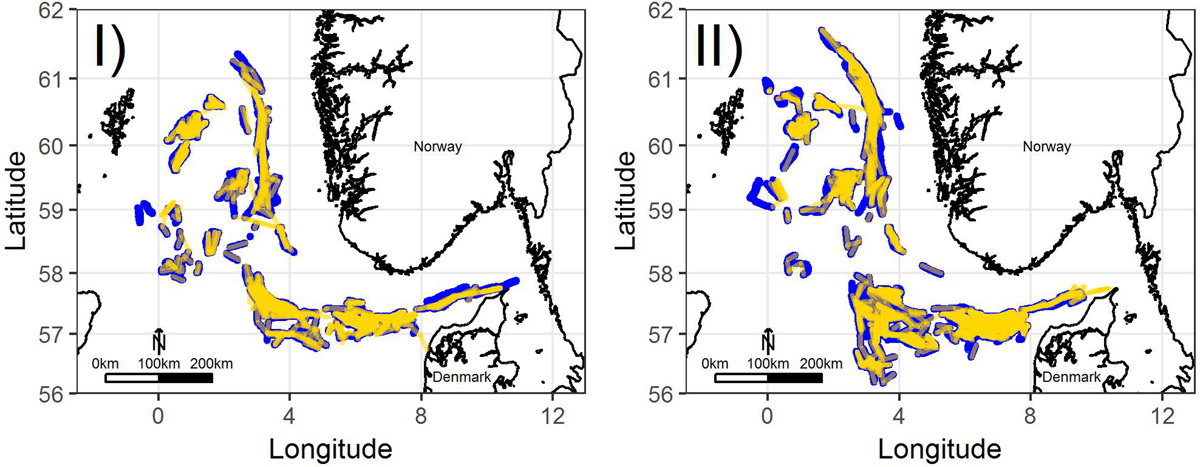
Fig. 5
Download original image
Fishing activity overlap between EM and SIF for two vessels. (I) 2015. (II) 2016. Blue points: Fishing activity recorded by EM GPS sensors (1-minute interval). Yellow lines: Hauls according to SIF. The EM trial did not cover the Baltic Sea and the maps do therefore not include hauls in this area.
Current usage metrics show cumulative count of Article Views (full-text article views including HTML views, PDF and ePub downloads, according to the available data) and Abstracts Views on Vision4Press platform.
Data correspond to usage on the plateform after 2015. The current usage metrics is available 48-96 hours after online publication and is updated daily on week days.
Initial download of the metrics may take a while.