Fig. 4
Download original image
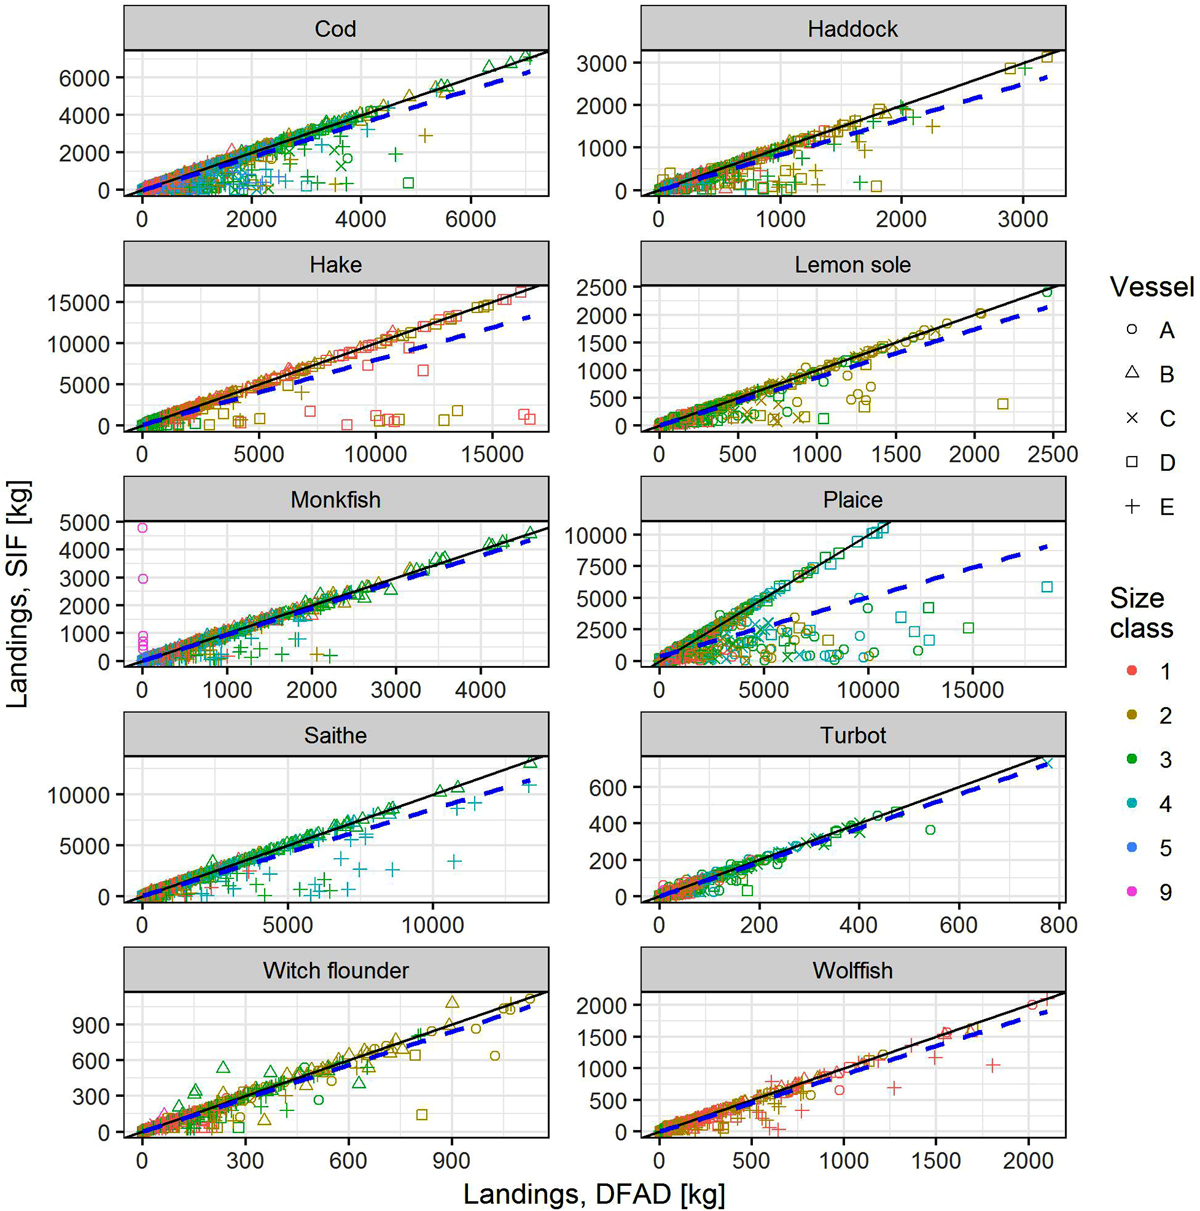
Landings per trip according to DFAD and SIF for the 10 most landed species in 2015 and 2016 by species and commercial size class. Points: the aggregated weight of the species and size class for a fishing trip. The x-axis represent the weight according to DFAD, the y-axis represent the weight according to SIF. Blue dashed line: linear model fit between DFAD and SIF. Black line: the 1:1 ratio between DFAD and SIF. Size class 9 is unsorted.
Current usage metrics show cumulative count of Article Views (full-text article views including HTML views, PDF and ePub downloads, according to the available data) and Abstracts Views on Vision4Press platform.
Data correspond to usage on the plateform after 2015. The current usage metrics is available 48-96 hours after online publication and is updated daily on week days.
Initial download of the metrics may take a while.