Free Access
Fig. 3
Download original image
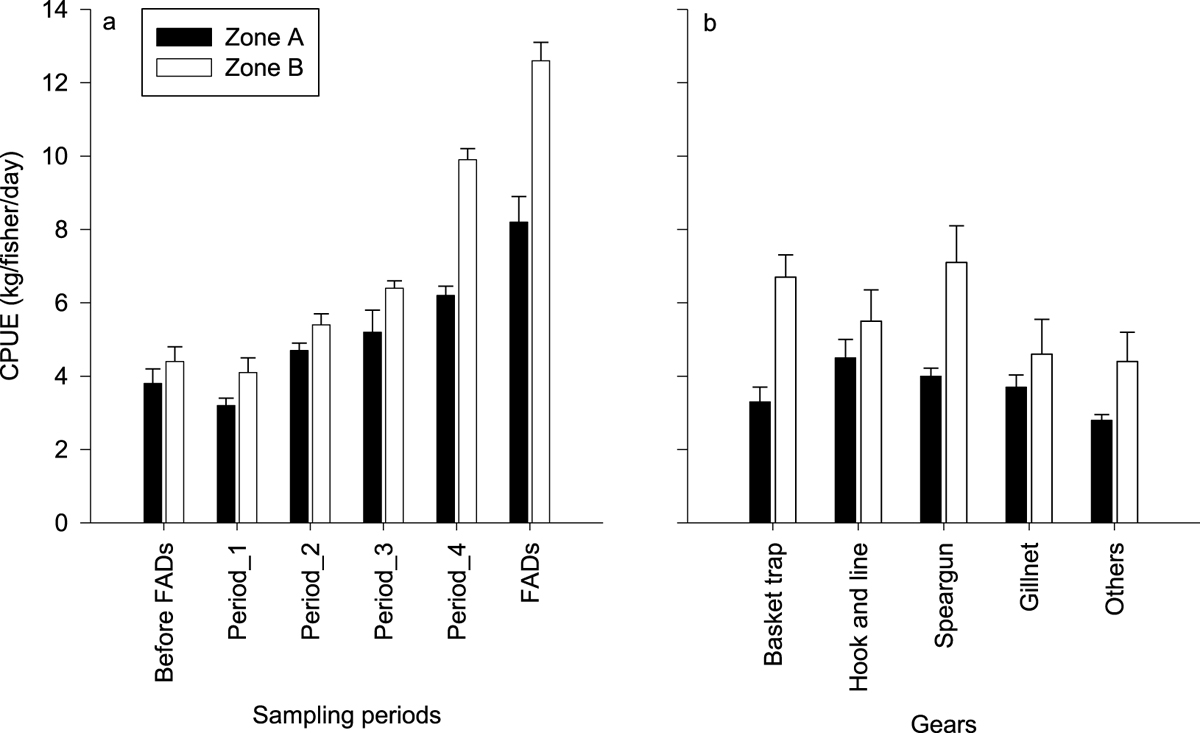
CPUE (kg fisher –1 day−1) from the two sampling zones before and after deployment of FADs based on (a) sampling periods and (b) Sampling effort for gear used in Zone A and Zone B. Period_1 − April 2014; Period_2 − June 2014; Period _3 −November 2014; Period_4 − February 2015.
Current usage metrics show cumulative count of Article Views (full-text article views including HTML views, PDF and ePub downloads, according to the available data) and Abstracts Views on Vision4Press platform.
Data correspond to usage on the plateform after 2015. The current usage metrics is available 48-96 hours after online publication and is updated daily on week days.
Initial download of the metrics may take a while.