Free Access
Fig. 8
Download original image
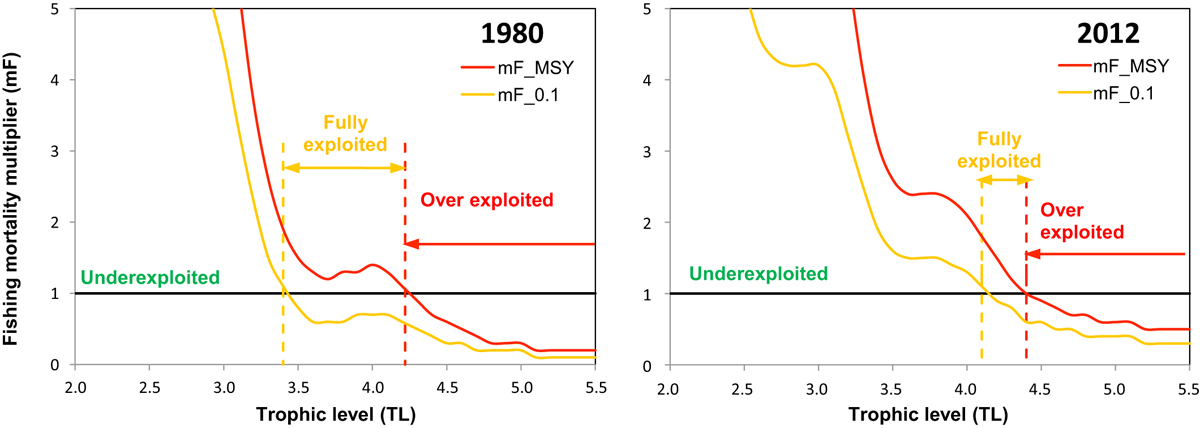
Indicators of the status of the resource per trophic class: values of the fishing effort multiplier leading to a full exploitation (E_0.1) or to overexploitation (E_MSY) in 1980 (left) and 2012 (right).
Current usage metrics show cumulative count of Article Views (full-text article views including HTML views, PDF and ePub downloads, according to the available data) and Abstracts Views on Vision4Press platform.
Data correspond to usage on the plateform after 2015. The current usage metrics is available 48-96 hours after online publication and is updated daily on week days.
Initial download of the metrics may take a while.