Fig. A1
Download original image
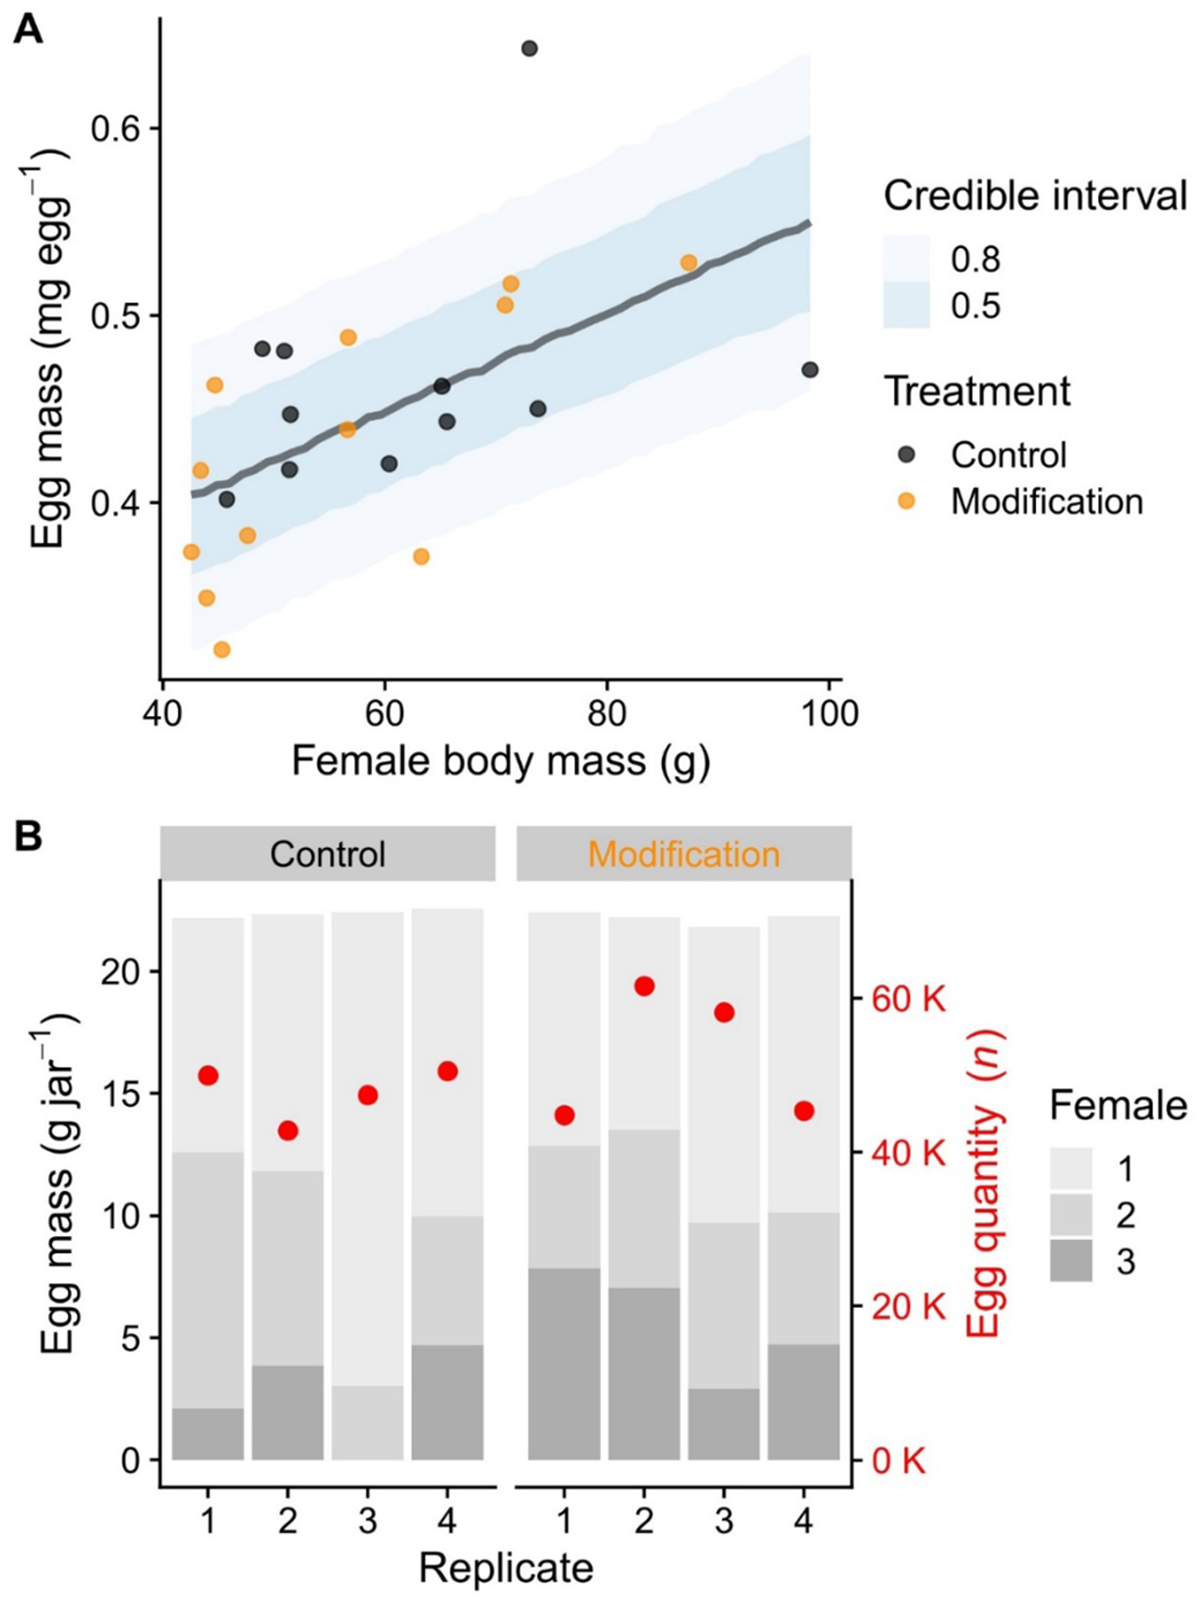
Relationship of body mass and individual egg weight of female smelt (n = 23) used in the trial (A). From the model’s posterior distribution, the median, combined for both treatments, is shown as the black regression line and the blue areas show the 0.5 and 0.8 quantile-based credible intervals. The model explained 33 [4, 53]% of the observed variability (Bayesian R2 , median and 95% lower and upper quantile intervals reported). Panel B shows the number of stripspawned female smelt, egg mass and the correspondent number of eggs per jar.
Current usage metrics show cumulative count of Article Views (full-text article views including HTML views, PDF and ePub downloads, according to the available data) and Abstracts Views on Vision4Press platform.
Data correspond to usage on the plateform after 2015. The current usage metrics is available 48-96 hours after online publication and is updated daily on week days.
Initial download of the metrics may take a while.