Fig. 3
Download original image
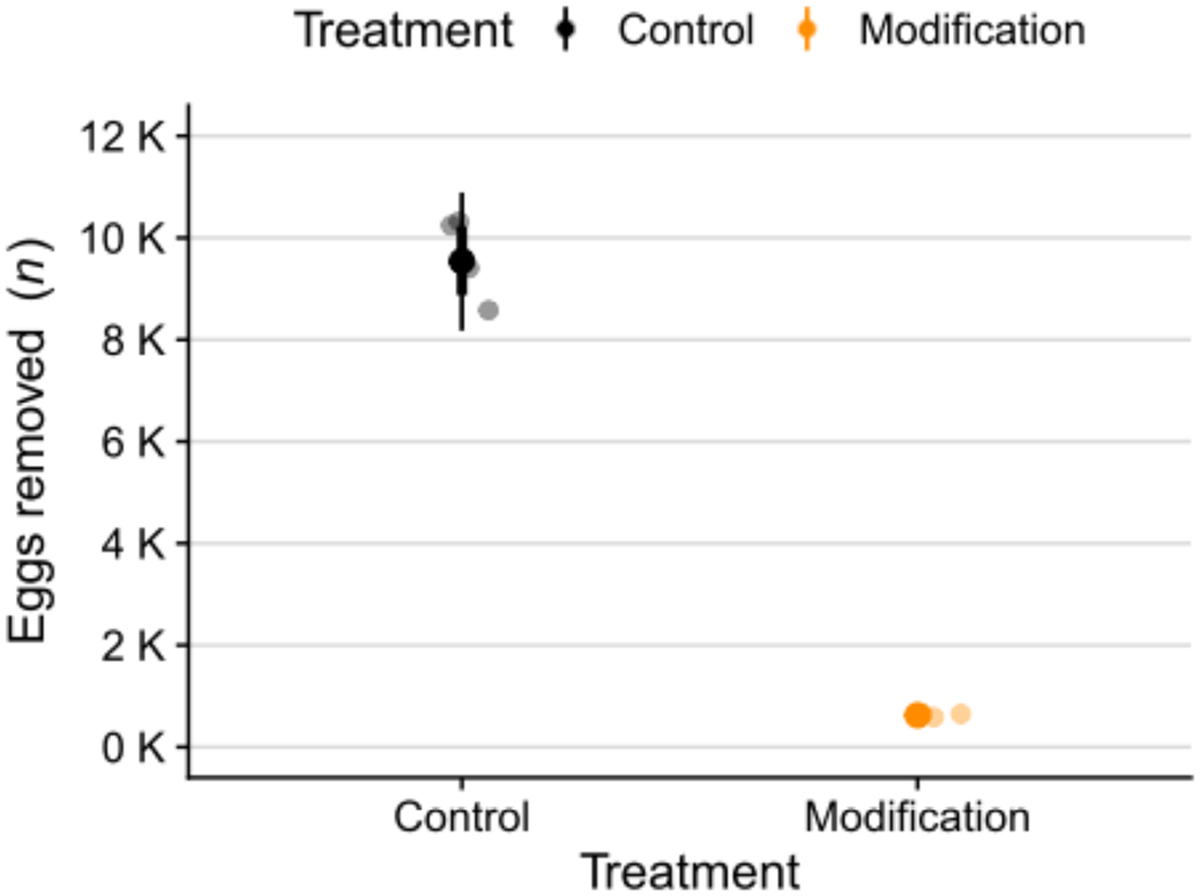
Number of accumulated eggs collected every other day from control (black) and modified (orange) jars during 2–8 days post fertilisation (dpf). Raw data for each jar are shown as semi-transparent point symbols, while point intervals show medians and 0.5 and 0.8 quantile-based credible intervals (thick and thin lines, respectively) from the model's posterior distribution.
Current usage metrics show cumulative count of Article Views (full-text article views including HTML views, PDF and ePub downloads, according to the available data) and Abstracts Views on Vision4Press platform.
Data correspond to usage on the plateform after 2015. The current usage metrics is available 48-96 hours after online publication and is updated daily on week days.
Initial download of the metrics may take a while.