Open Access
Fig. 3
Download original image
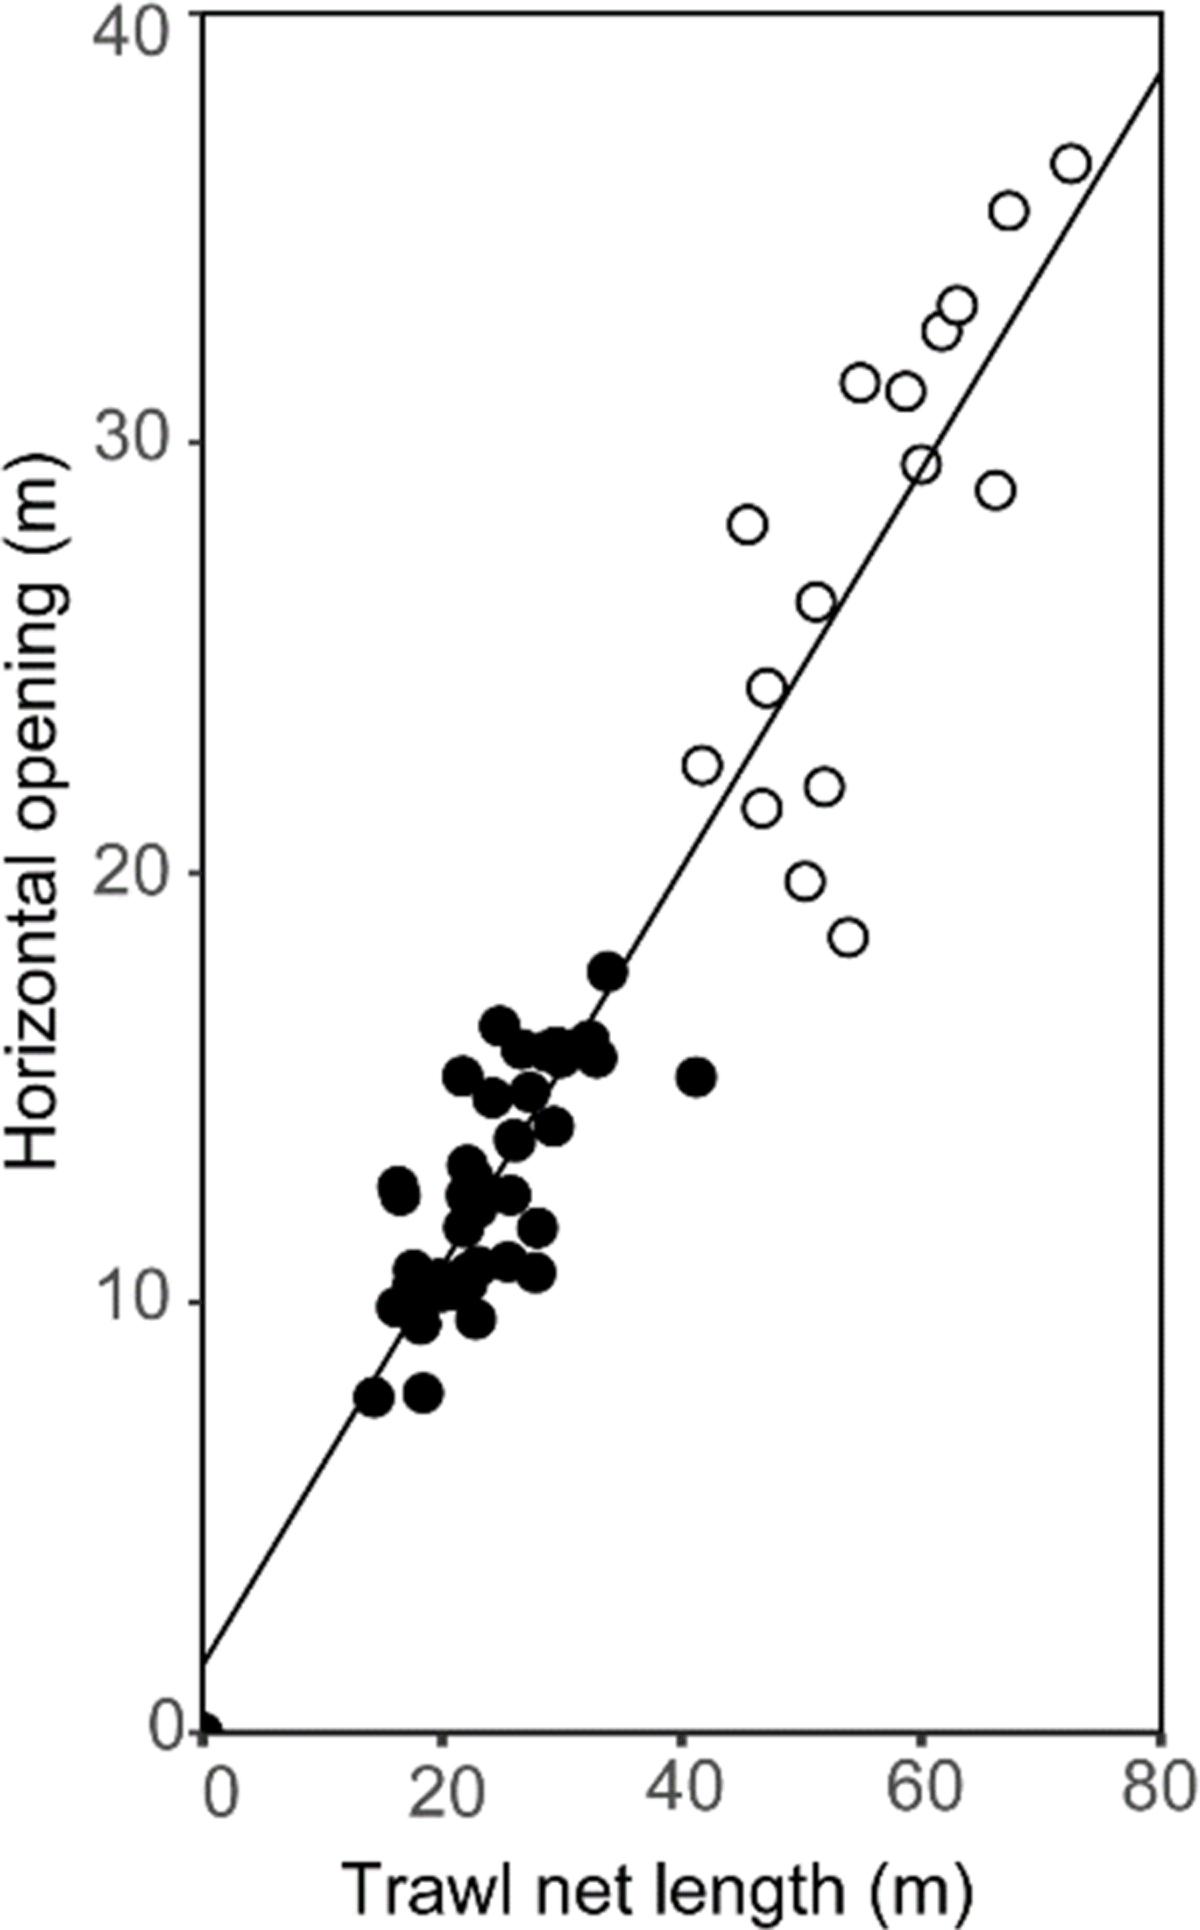
Relationship between the horizontal opening and length of mosquito net trawls (n = 57) in the study area. The linear relationship is showed by the dotted line (y = 0.502x, R2 = 0.904). Black and white spots represent the villages of Ankilibe and Ankiembe, respectively (see Fig. 1 for village location).
Current usage metrics show cumulative count of Article Views (full-text article views including HTML views, PDF and ePub downloads, according to the available data) and Abstracts Views on Vision4Press platform.
Data correspond to usage on the plateform after 2015. The current usage metrics is available 48-96 hours after online publication and is updated daily on week days.
Initial download of the metrics may take a while.