Fig. 1
Download original image
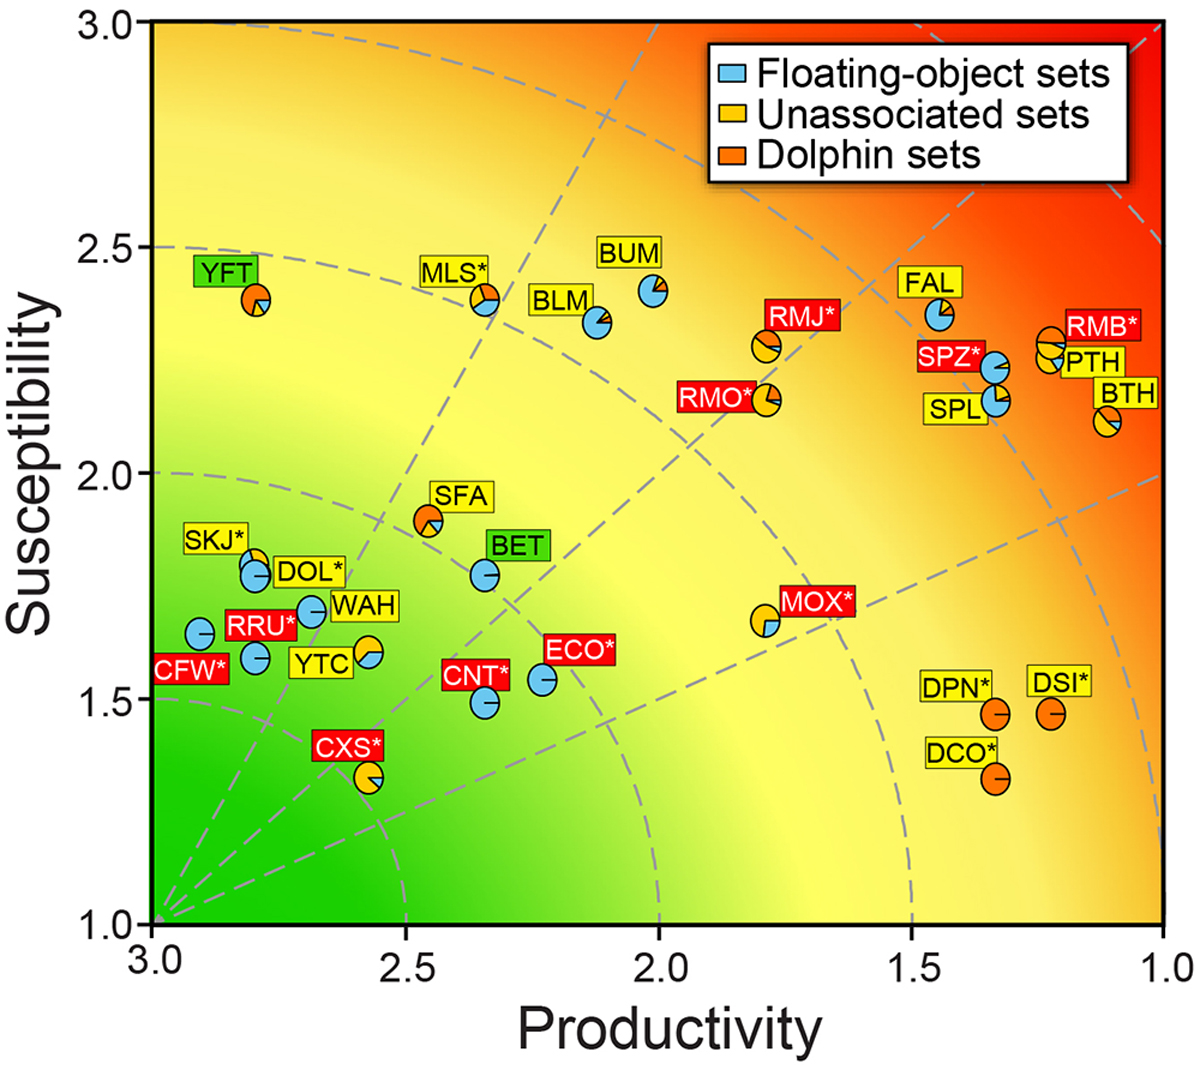
Scatterplot depicting results of the productivity-susceptibility analysis (PSA) for the purse-seine fishery in the eastern Pacific Ocean. Vulnerability (v) isopleths (dashed lines) with values of 0.5, 1.0, 1.5, 2.0 define the boundaries of “low” (v ≤ 1.0, green), “moderate” (1 < v < 2, yellow), and “high” (v ≥ 2.0, red) relative vulnerability. The proportion contribution by each species to the catch by purse-seine set type is displayed in the pie charts. Coloured boxes represent mean data quality (DQ) score: green = high (DQ < 2), yellow = moderate (3 < DQ ≥ 2), red = low (DQ ≥ 3). Figure and caption from Duffy et al. (2019). Species codes are defined in Table 3. (For interpretation of the references to colour in this figure legend, the reader is referred to the web version of this article.)
Current usage metrics show cumulative count of Article Views (full-text article views including HTML views, PDF and ePub downloads, according to the available data) and Abstracts Views on Vision4Press platform.
Data correspond to usage on the plateform after 2015. The current usage metrics is available 48-96 hours after online publication and is updated daily on week days.
Initial download of the metrics may take a while.