Free Access
Fig. 4
Download original image
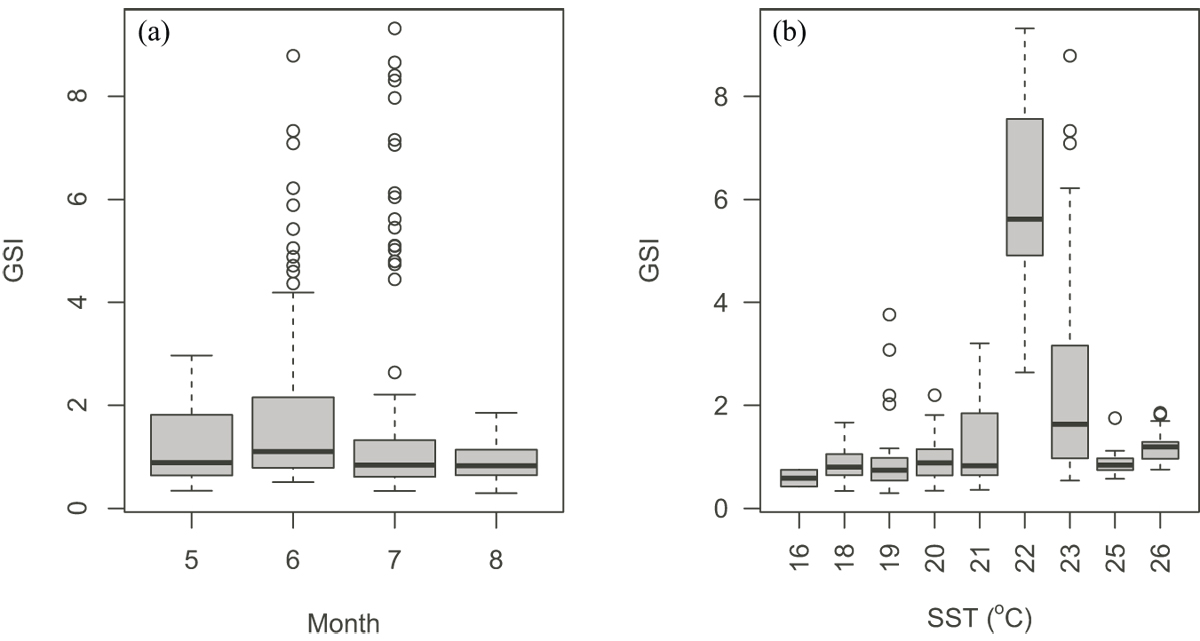
Boxplots of GSI (gonad somatic index) across (a) months and (b) sea surface temperature. Median values (solid horizontal lines), 50th percentile values (box outline), 90th percentile values (whiskers), and outlier values (open circles) are indicated in the figure.
Current usage metrics show cumulative count of Article Views (full-text article views including HTML views, PDF and ePub downloads, according to the available data) and Abstracts Views on Vision4Press platform.
Data correspond to usage on the plateform after 2015. The current usage metrics is available 48-96 hours after online publication and is updated daily on week days.
Initial download of the metrics may take a while.