Fig. 1
Download original image
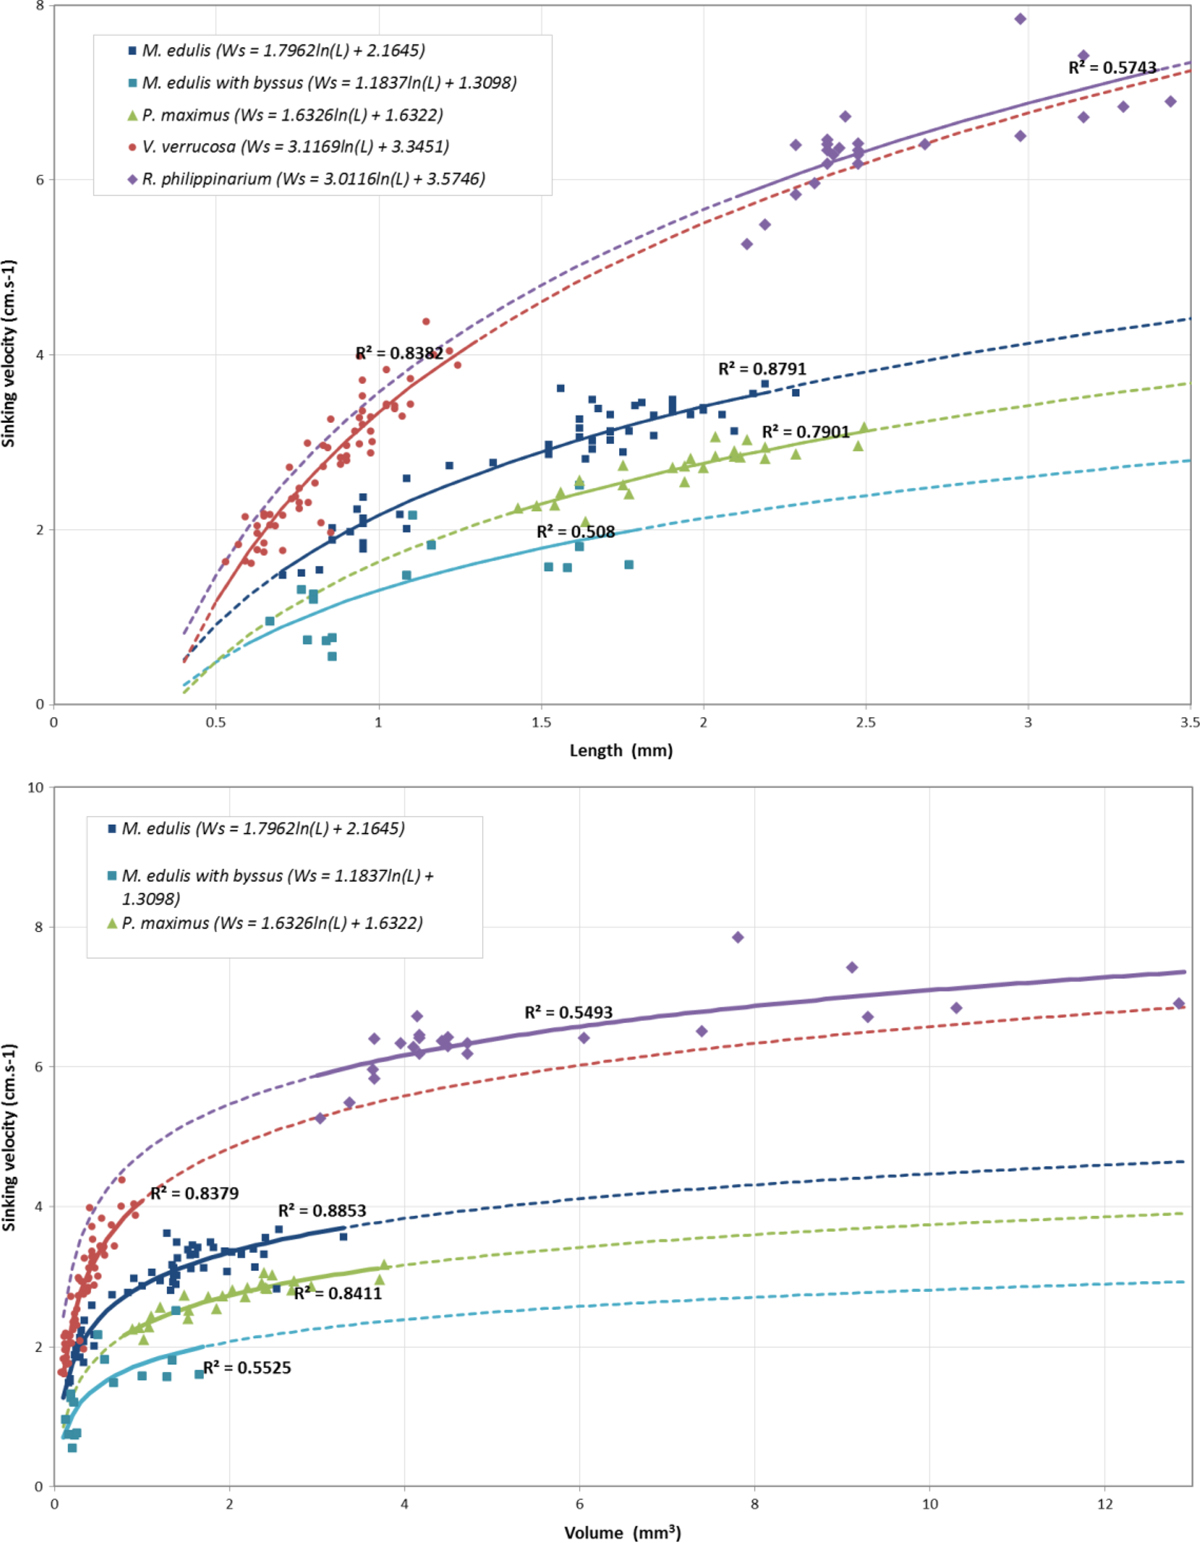
Relationships between sinking velocity and volume (top graphic) or shell length (bottom graphic) for actives recruits of the four species and mussel recruits producing byssus thread. Lines are logarithmic regression curves (Ws = a × ln(Size) + b) with their respective coefficients of determination (R2), the solid lines relate to the size range of the individuals studied for each species and the dashed lines correspond to an extension of the regression outside this range.
Current usage metrics show cumulative count of Article Views (full-text article views including HTML views, PDF and ePub downloads, according to the available data) and Abstracts Views on Vision4Press platform.
Data correspond to usage on the plateform after 2015. The current usage metrics is available 48-96 hours after online publication and is updated daily on week days.
Initial download of the metrics may take a while.