Fig. 3
Download original image
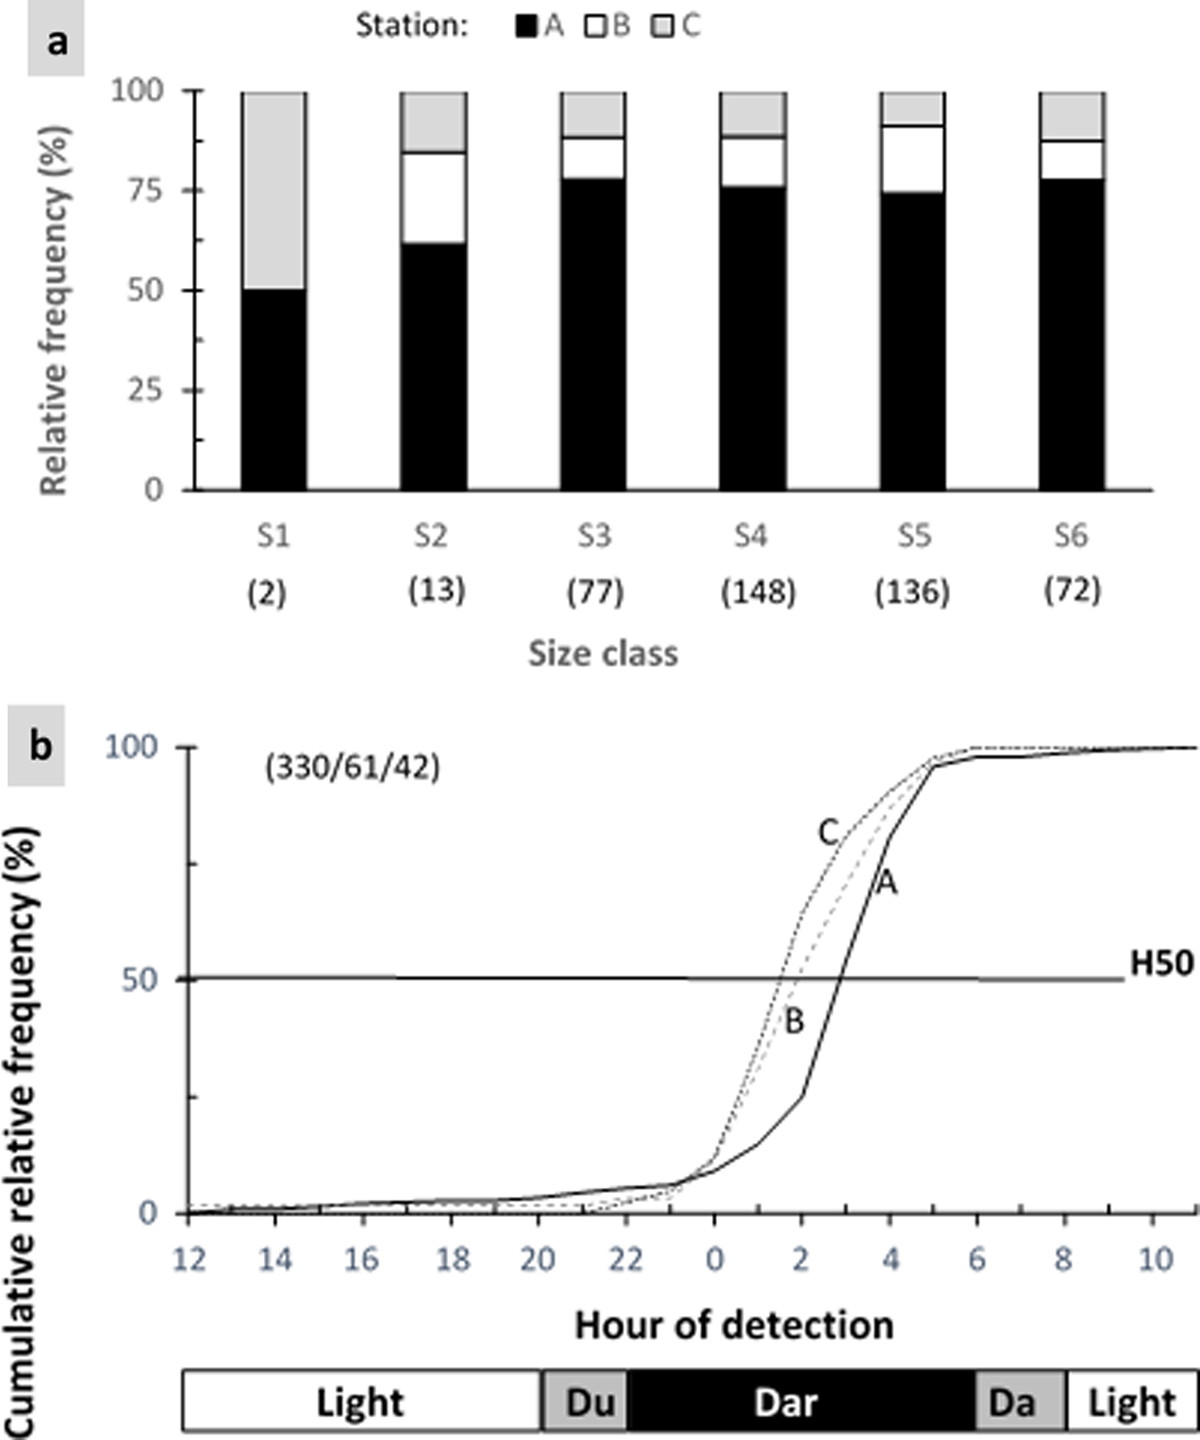
Frequencies of ascending yellow eels according to size classes (a) and hour of detection (b). H50 indicates the hour of detection of 50% (median) of the eels; A, B and C specify detection stations at the first upstream detection station A (Monsin) in the Meuse, B (Yvoz-Ramet) on route 1 in the upper Meuse, and C (Angleur) on route 2 in the Ourthe tributary. Numbers in brackets indicate the sample size of eels detected by size classes and stations A, B and C, respectively. Du and Dar correspond to dusk and dawn, respectively.
Current usage metrics show cumulative count of Article Views (full-text article views including HTML views, PDF and ePub downloads, according to the available data) and Abstracts Views on Vision4Press platform.
Data correspond to usage on the plateform after 2015. The current usage metrics is available 48-96 hours after online publication and is updated daily on week days.
Initial download of the metrics may take a while.