Fig. 3
Download original image
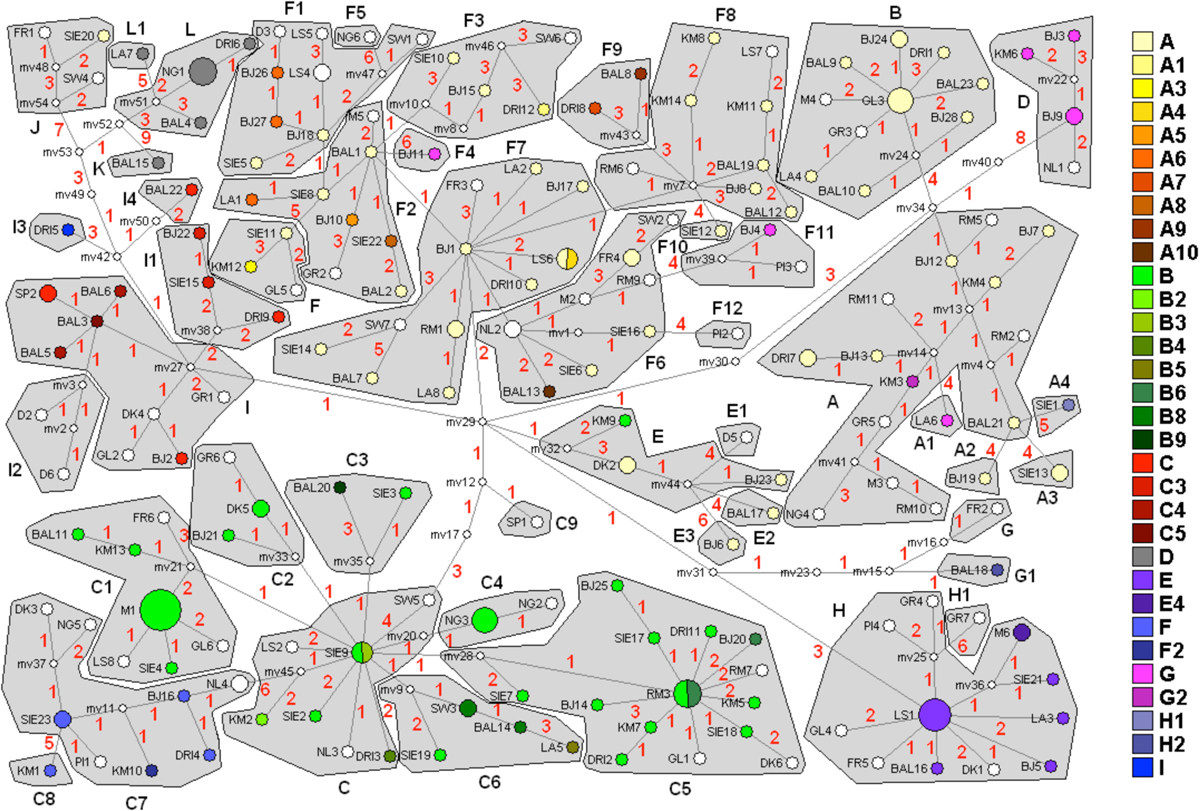
The distribution of mtDNA cyt b haplotypes plotted on the maximum parsimony (MP) haplotype–haplogroup network of A. anguilla mtDNA D-loop region (Ragauskas et al., 2014): numbers between the nodes are mutational steps between the most closely related sequences; the radius of the circles is proportional to the frequency of mtDNA D-loop region haplotypes; mv represent hypothetical sequences that were not found during the study but are important to the construction of the haplotype network; gray shapes represent different haplogroups of mtDNA D-loop region; different colors represent different mtDNA cyt b haplotypes; white circles represent mtDNA D-loop region haplotypes detected in the eels that were not examined using mtDNA cyt b.
Current usage metrics show cumulative count of Article Views (full-text article views including HTML views, PDF and ePub downloads, according to the available data) and Abstracts Views on Vision4Press platform.
Data correspond to usage on the plateform after 2015. The current usage metrics is available 48-96 hours after online publication and is updated daily on week days.
Initial download of the metrics may take a while.