Free Access
Fig. 5
Download original image
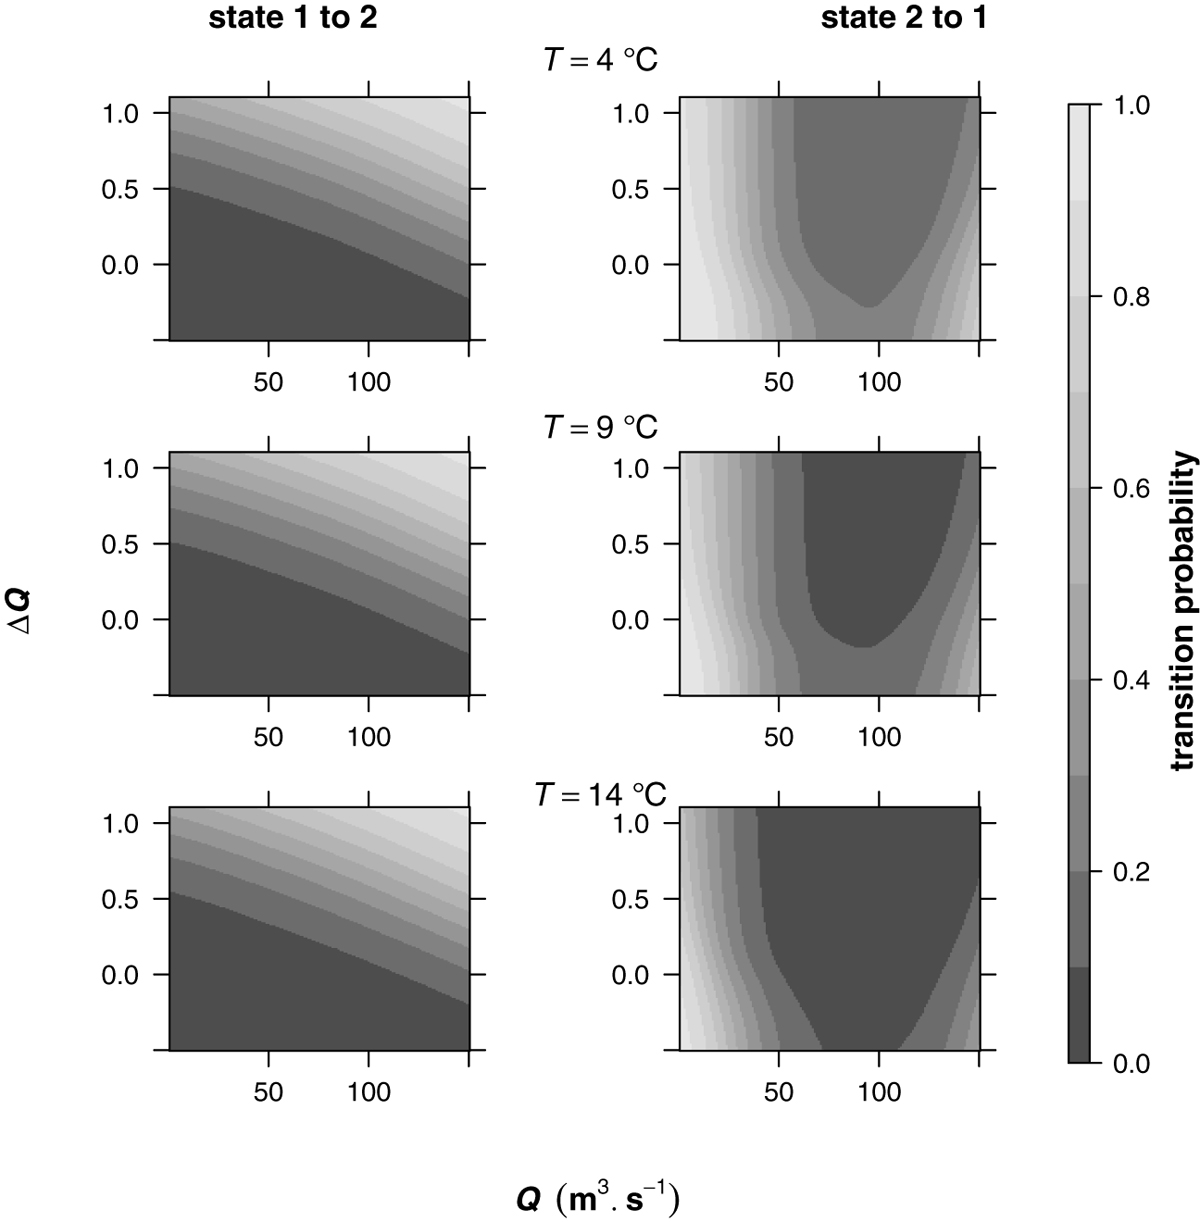
States (state 1 = pause, state 2 = active migration) transition probabilities predicted by the model at different level of Q and ΔQ and different temperatures (4 °C, first line − 9 °C which corresponds to the observed average, second line − 14 °C, third line).
Current usage metrics show cumulative count of Article Views (full-text article views including HTML views, PDF and ePub downloads, according to the available data) and Abstracts Views on Vision4Press platform.
Data correspond to usage on the plateform after 2015. The current usage metrics is available 48-96 hours after online publication and is updated daily on week days.
Initial download of the metrics may take a while.