| Issue |
Aquat. Living Resour.
Volume 38, 2025
|
|
|---|---|---|
| Article Number | 10 | |
| Number of page(s) | 14 | |
| DOI | https://doi.org/10.1051/alr/2025008 | |
| Published online | 09 June 2025 | |
Research Article
Commercial vs. survey data in length-based stock assessment: insights from Turkish crayfish fisheries
1
Isparta University of Applied Sciences, Eğirdir Fisheries Faculty, Isparta, Türkiye
2
District Directorate of Provincial Agriculture and Forestry, Eğirdir, Isparta, Türkiye
* Corresponding author: mehmetcilbiz@isparta.edu.tr
Received:
1
April
2024
Accepted:
9
May
2025
In length-based stock assessments for data-poor fisheries, commercial fishing data is often used due to its cost-effectiveness and accessibility. However, factors such as gear selectivity, seasonal closures, minimum conservation reference size (MCRS) regulations, and market-driven harvesting practices can render commercial catch data unrepresentative of the true population structure. Reliance on such data without correction or complementary sampling may lead to biased stock assessments, undermining effective fisheries management. This study investigates how length data from commercial fisheries and experimental sampling influence the estimation of biological reference points (BRPs) and explores differences in catch compositions between these data sources. Between June 2021 and May 2022, a study was conducted at Lake Eğirdir (Isparta, Türkiye), involving 10 different stations. A total of 400 fyke nets were deployed, consisting of 200 experimental and 200 commercial ones. The experimental fyke nets had a stretched mesh size of 18 mm, while the commercial ones had a mesh size of 34 mm. These nets were evenly distributed, with 40 nets at each station. TropFishR package was used for estimating of the life history parameters and stock assessment. The comparison of catch composition was performed using “Length-dependent catch comparison” and “catch ratio” analyses through the SELNET program. As a result, it has been determined that, due to the potential size selectivity feature, the commercial fyke net is unsuccessful in catching small-sized individuals (<4 cm carapace length), while the experimental fyke net is unsuccessful in catching advanced-sized crayfish (>6.5 cm carapace length). The estimated BRPs showed significant differences depending on the data source, and there were also differences of up to 56% in the recommended total allowable catch (TAC) amounts. As a result, it is considered that relying solely on commercial or experimental fyke nets for crayfish may be misleading, and it would be more appropriate to use both for successful sampling and stock assessment.
Key words: Data-limited fishery / Eğirdir Lake / fisheries management / length-based assessment / narrow-clawed crayfish / stock assessment
© M. Cilbiz et al., Published by EDP Sciences 2025
 This is an Open Access article distributed under the terms of the Creative Commons Attribution License (https://creativecommons.org/licenses/by/4.0), which permits unrestricted use, distribution, and reproduction in any medium, provided the original work is properly cited.
1 Introduction
Inland waters serve as a livelihood for 820 million people, and inland fisheries are of vital importance globally for numerous vulnerable groups in terms of social, economic, and nutritional aspects (Ainsworth et al., 2023; Coates, 2023). Global estimates of employment in inland fisheries vary significantly, but it is believed that approximately 17 million people work in this sector (Funge-Smith 2018; Coates, 2023). Despite the crucial role of inland fisheries, they have frequently been undervalued and overlooked at both national and regional levels, often pushed to the background in the frameworks of agriculture, water, environmental, and social policies (Cooke et al., 2016; Moutopoulos et al., 2022; Ainsworth et al., 2023). Several inland fisheries worldwide are less well known than marine fisheries and are not subjected to science-based management decisions, raising concerns about their sustainability (Suresh et al., 2023). Inland fisheries have never been included in any prominent global fisheries assessments owing to data reliability issues (Cooke et al., 2016).
Understanding the status of fish stocks is essential for effective management (Ovando et al., 2022). Successful stock management can only be achieved through the collection of high-quality and comprehensive scientific fisheries data (such as for data-rich assessment models), which is then thoroughly assessed and applied in practice. However, formal stock assessments are lacking for at least half of the global catch and a vast majority of global fisheries, mainly due to insufficient data (Ovando et al., 2022).
Major commercial fish species typically have extensive datasets that can be incorporated into complex stock assessment models (e.g., Methot and Wetzel 2013); these data may involve time series of total removals (I), catch-at-length or −at-age (II), relative or absolute abundance indices (III), fishing effort (IV), and information on life-history parameters (V). The datasets in mentioned are generally unavailable for most of the small-scale fisheries (Pons et al., 2020), especially in developing countries (Raza et al., 2022) and inland fisheries (Reis-Filho et al., 2023). Traditional stock assessment methods not able to estimate sustainable fishing levels for the majority of world fish stocks due to a lack of data (Raza et al., 2022). Fisheries and stocks without comprehensive datasets are commonly referred to as “data-poor” or “data-limited” fisheries (Costello et al., 2012; Dowling et al., 2015).
Length data provides a straightforward and efficient method for assessing the status of fish populations in inland system (Miranda et al., 2024). The length-frequency data from commercial catches are often the primary collected data type in data-limited fisheries, because they are relatively economical and easy to obtain (Pilling et al., 2009; Hordyk et al., 2015; Mildenberger et al., 2017; Chong et al., 2019). Although Kilada and Acuña (2015) proposed a method for determining the chronological age of crustaceans using gastric mill ossicles, it has not gained widespread acceptance among assessors, and stock assessments of crustaceans are still predominantly based on a length-based approach (Korkmaz et al., 2023; Hashemi et al., 2024; Jin et al., 2024; Scanu et al., 2024). However, relying solely on commercial fishing data for the necessary input in length-based stock assessment studies may risk the obtained sample not accurately representing the population. Landed catch data alone cannot reliably indicate stock growth and status (Ovando et al., 2022) as total landings are affected by multiple factors, such as market changes, changes in catchability and regulations, and reductions in fishing effort, changes in fish abundance (de Mutsert et al., 2008) in addition to fishing gear selectivity (Fitzgerald et al., 2023; Hordyk et al., 2015). According to Pauly and Morgan (1987), the use of commercial length compositions is far less effective for length-based modal analysis compared to data obtained from research surveys, primarily due to the regulations on minimum mesh sizes and landing sizes in commercial fisheries. The use of incomplete length-frequency data in stock assessment can lead to the generation of erroneous results and, consequently, pose management issues.
Due to the ease and cost-effectiveness of data collection, commercial fishing data is commonly used in length-based stock assessment studies (Alam et al., 2022; Barua et al., 2023; Da et al., 2023; Dutta et al., 2023; Kindong et al., 2022; Tesfaye et al., 2021). Commercial catch data often overestimate the health of fish stocks. For instance, catch trends may misrepresent actual stock status, leading to incorrect assessments of stock health (Branch et al., 2011). Such misclassifications can result in overexploitation, as managers may fail to recognize the true extent of depletion. Furthermore, improvements in fishing technology—termed technological creep—can obscure population declines. For example, advancements in trap designs for European lobsters created the illusion of stable or increasing catch rates even as stocks declined (Kleiven et al., 2022). Such delays in detecting declines can postpone critical management interventions, exacerbating overfishing and accelerating stock collapse, as seen in the case of Newfoundland's northern cod (Walters & Maguire, 1996). In situations such as fishing gear selectivity and under sized landed catch (below the minimum conservation reference size: MCRS), some studies have utilized data from both sources (commercial and survey catch) to reduce the error rate in the population's length distribution (Ersönmez et al., 2023; Korkmaz et al., 2023; Sarr et al., 2023). In some studies, only survey data has been used (Aydın & Tıraşın, 2023; Cilbiz & Uysal, 2023; Dağtekin, 2023; Santos et al., 2023). In previous studies, the sampling strategy, or in other words, how the sampling strategy or the data source used in assessments represents the population length distribution and its effects on the estimated biological reference points (BRPs) have not been clearly demonstrated. This study evaluates the effect of commercial, experimental, or/and combined data sources on biological reference point (BRP) estimates in a crayfish length-based stock assessment, alongside the catch efficiency of fishing gear across population length classes.
2 Material and methods
2.1 Study area
The study was conducted in Lake Eğirdir (Fig. 1), which serves as the primary crayfish harvesting centre in Türkiye. Ten sampling stations were utilized, each representing the fishing area of different fisheries cooperatives. Eğirdir Lake, the second largest freshwater resource in Türkiye, covers an area of 457 km2 and is situated between latitude 37° 50′ 41″–38° 16′ 55″ N and longitude 30° 57′ 43″–30° 44′ 39″ E in the southwest of Türkiye (Özseven et al., 2020; Şener et al., 2019).
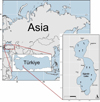 |
Fig. 1 Maps show global location of Eğirdir Lake and distribution of the 10 sampling stations on the lake. |
2.2 Data collection
Both survey and commercial length data were collected with survey fishing. In the study, for obtaining commercial length data, it was preferred to use 34 mm stretched mesh size fyke nets (Com.) that fishermen use for fishing instead of collecting the length data of the catch made by the fishermen. The main reasons for this preference are (I) the closed season application for fishing (from 01 November to 30 June), resulting in an 8-month interruption in commercial fishing data, and (II) the idea that data for combined groups (commercial and experimental) are obtained from identical fishing trials. A total of 400 fyke nets were used in the study, 200 of which were commercial crayfish fyke net (Com.) and 200 of which were experimental crayfish fyke net (Exp.) with 18 mm stretched mesh size and poor length selectivity. General view and technical plan of fyke nets used in study were given as supplementary materials. At each of the ten stations, a total of 40 fyke nets were used (40 fyke net x 10 station), with 20 being commercial and 20 being experimental, randomly connected to each other from the end ropes of the last codend (Fig. 2). Fishing trials were conducted monthly from June 2021 to May 2022. Fishing trials were conducted at the same stations every month. The fyke nets were typically left to soak for two days unless any unforeseen issues arose, resulting in an average soak time of 48 hour. The captured crayfish were classified according to the sampling stations, and their carapace length (CL) and abdomen length (AL) were measured using a digital calliper with a sensitivity of 0.01 mm. The total length (TL) of each individual was calculated by adding together the carapace and abdomen lengths. The total weight (TW) of the crayfish was measured using digital scales with a sensitivity of 0.01 g. Additionally, the sex of the crayfish was determined macroscopically.
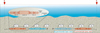 |
Fig. 2 General view of combined experimental fyke nets on the lake bottom. |
2.3 Stock assessment
The successful determination of the LWR parameters, which serve as input data for the Yield per Recruitment analysis, is crucial for accurate stock assessment. The relationship between length and weight of crayfish was described by equation [I]. In this equation, L represents the total or carapace length in centimetres, W represents the total weight in grams, and a and b values denote the constant parameters of the equation (Froese, 2006). “ggtrendline” R package was used for computing of model parameters (Mei et al., 2022). A t-test was used to determine the b value different from 3 or not (Pauly, 1984). The computed a and b values for both sexes were utilized as input parameters for the “Yield per Recruit analysis” in TropFishR (v.1.6.3) R package (Taylor & Mildenberger, 2017). The Electronic LEngth Frequency ANalysis (ELEFAN) method was employed to estimate the growth parameters (Pauly & David, 1981). The data analysis was conducted using the TropFishR. The seasonally oscillating von Bertalanffy growth function (soVBGP), developed by Somers (1988), was employed in modelling the growth of crayfish [II]. Optimisation of the growth parameters ELEFAN with Generalized Simulated Annealing (ELEFAN_SA) and Genetic Algorithm (ELEFAN_GA) function was used (Scrucca, 2013; Xiang et al., 2013). Natural mortality is estimated using the length-based updated Pauly estimator recommended by Then et al. (2015) [III]. The linearized length-converted catch curve method [IV] was used for estimating of the instantaneous rate of total mortality (Z) (Pauly, 1990; Pauly et al., 1995). The fishing mortality rate (F) was computed by equation [V]. The exploitation rate (E) was calculated by the formula [VI]. In the estimating of the stock size length-based virtual population analysis (VPA) was used (Jones, 1984). The Thompson and Bell (1934) model was used to estimate the relative yield per recruit (Y'/R) and reference points. Length-based spawning potential ratio (SPR) was estimated based on (Goodyear, 1993) [VII]. In this study, carapace length (in mm) was utilized in the length frequency analysis due to its more rigid structure compared to total length. The calculated optimal bin size (OBS) was approximately 3 mm using Wang et al. (2020)' equation [VIII]. As an input parameters of spawning potential ratio analysis, Wmat (weigth at which 50% of the crayfish are mature) and Lmat (length at which 50% of the crayfish are mature) were applied as 17.33 g and 43.43 mm carapace length respectively by (Korkmaz et al., 2023). The stock assessment process was conducted through three groups: (I) crayfish collected only from Exp. Fyke nets, (II) crayfish collected only from Com. fyke nets, and (III) polled of both. This allowed the investigation of the combined effects of fyke nets with different size selectivity on the BRPs.


2.4 Catch efficiency
Length-dependent catch comparison and catch ratio analyses were conducted to compare the catch efficiency between commercial and experimental fyke net codend (Cerbule et al., 2021; Fakıoğlu et al., 2023; Lomeli et al., 2020; Lomeli et al., 2021). The length-dependent catch comparison rate CC(l,v) and catch ratio CR(l,v) were estimated for the P. leptodactylus to investigate potential differences in catch efficiency for each. Equation [IX] was used by us for assessing of the relative length dependent catch comparison rate (CCl) of changing from one codend to another codend (Lomeli et al., 2021; Cerbule et al., 2021; Fakıoğlu et al., 2023). The modelled catch comparison rate CC(l,v) that experimentally was expressed by equation [IX] was obtained using maximum likelihood estimation by minimizing the Expression [X] (Lomeli et al., 2021; Fakıoğlu et al., 2023). The experimental CCl was modelled by the function CC(l,v) using the equation [XI] (Fakıoğlu et al., 2023). Catch ratio CR(l,v) equation [XII] was used for providing of direct relative value of catch efficiency between compared experimental and commercial fyke net codend (Lomeli et al., 2021; Cerbule et al., 2021, Fakıoğlu et al., 2023). Double bootstrapping method with 1000 bootstrap repetitions was used for estimating of the Efron 95% (Efron, 1982) confidence intervals (CIs) for both catch comparison and catch ratio. Catch efficiency equilibrium points of compared panels were 0.5 for catch comparison rate and 1.0 catch ratio (Fakıoğlu et al., 2023). The statistical software SELNET was used for relative catch efficiency analysis in this study (Herrmann et al., 2016; Herrmann et al., 2012).


2.5 Statistical analysis
For the statistical comparison of mean carapace lengths among codends, t-tests were used for data with a normal distribution, while the Wilcoxon rank-sum test (Mann–Whitney U test) was employed for data with a non-normal distribution. The Kolmogorov-Smirnov (K-S) test was used to determine whether there was a difference in length frequency distributions among codend types (Com., Exp, Comb.) in the sample. The data were analysed using the rstatix v0.7.2 (Kassambara, 2023) and fishmethods v.1.12-1 (Nelson, 2023) packages, while visualization was performed using the ggplot2 v3.4.4 (Wickham, 2016) package in the Rstudio v2023.12.0 (RStudioTeam, 2023) program.
3 Results
3.1 Catch composition
At the end of the fishing experiments, a total of 10,680 crayfish were captured. The total length range was 30.23–163.38 mm (50.00–163.38 mm for commercial catches and 30.23–148.41 mm for experimental catches) and the carapace length ranged from 15.35 to 80.62 mm. The sample consists of 49.5% females and 50.5% males. In the evaluation made in numbers, January was the least productive month, with only 0.3% of crayfish caught, while April was the most productive, with 20.3% of the total catch. A statistical difference in the mean carapace lengths of crayfish from commercial and experimental codends was observed (p < 0.01). While there was no statistical difference between the mean carapace lengths according to sex (p > 0.05), there was a statistical difference between the mean total lengths (p < 0.05) lengths. This difference was significant in all months except January (Tab. 1). The length frequency distribution of caught crayfish by sampling month and codend type (Fig. 3) indicates that the experimental fyke net with a smaller mesh size is generally more effective in catching smaller crayfish in all months. In contrast, the commercial fyke net is more effective in catching larger size crayfish. The length frequency distribution of the crayfish varies according to the sampling month.
The results of the K-S test used to determine whether there is a difference in the polled length frequency distributions of caught crayfish in different codends are given in Table 2. While a statistical difference was found in the Com. ∼ Exp. comparison, there was no statistical difference in the length frequency distribution between the captures of the two pooled nets and those obtained individually in each net (Exp. and Com.).
Monthly carapace length distribution (mm) of P. leptodactylus by sampling codend.
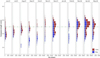 |
Fig. 3 Length frequency distribution of P. leptodactylus by codend type and sampling month (The dashed green horizontal line represents MCRS). |
Results of the K-S test used to compare length frequency distributions between pairs of codends.
3.2 Length-weight relationship (LWR)
Therefore, in the study, the LWR of crayfish were determined separately based on the fyke nets they were caught (Tab. 3). The b value for crayfish caught in the Com. codend (3.199) was found to be slightly higher compared to those caught with Exp. (3.062). As a result, all three groups exhibited allometric growth type.
LWR model parameters of P. leptodactylus.
3.3 Growth properties
The simulated annealing algorithm was found to be more successful in estimating the VBG parameters of Com. and Exp. groups, while the genetic algorithm was more successful in estimating the VBG parameters for the Comb. group within the maximum score value. The K, L∞ and to parameters were estimated as 0.32 year−1, 85.38 mm ve −0.36 year for Com. groups; 0.54 year−1, 86.62 mm ve −0.24 year for Exp. groups and 0.57 year−1, 87.54 mm ve −0.09 year for Comb. groups respectively. While the L∞ values were found to be close to each other, it can be said that especially the K parameter is significantly influenced by the fyke net used in the sampling (Tab. 4). The seasonally oscillating growth curves were fitted for three data set by using growth parameters given in Table 4 (Fig. 4).
von Bertalenffy Growth Function (VBGF) parameters of P. leptodactylus by caught codend groups.
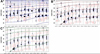 |
Fig. 4 Length-frequency histograms with the fitted growth curves (A: Commercial catch data B: Experimental catch data C: Combined Data). |
3.4 Evaluating of stock status
Significant differences in BRPs were identified according to the sampling group in the study. The current F values were estimated as 1.26, 3.14, and 1.35 for the Com., Exp., Comb. groups, respectively. The total mortality coefficient (Z) showed a significant difference ranging from 1.68 to 3.74 among the groups. The exploitation value (E) varied between 0.75 and 0.84. The Fcurr/Fmax values, which are important indicators of the exploitation status of the stock, were computed as 1.22, 2.01, and 1.95 for the Com., Exp., and Comb. groups, respectively (the desired value is below 1). The SPR value is computed as the highest for the Com. group at 0.25 and the lowest for the Comb. group at 0.17 (Tab. 5).
The impact of alterations in fishing mortality on the BRP of P. leptodactylus by sampled fyke nets.
3.5 Catch efficiency between codends
In the carapace length class of 1.5–3.5 cm, the Exp. codend is much more effective, there is relative equality at 4.0 cm, and between 4.5 and 8.0 cm, the Com. codend is more effective (Fig. 5). According to the “S” type selectivity curve approach (assuming that all individuals above a certain size at retention level 1 are caught), in the CR curve, which is expected to remain stable at the 0.5 level in a certain size class, and in the CC curve, which is expected to remain stable at the 1.0 level, it is observed that the effectiveness of the Com. codend increases compared to the Exp. codend above 4.5 cm carapace length (Fig. 5).
The catch comparison (Fig. 5) and catch ratio analysis results (Tab. 6) for P. lepdodactylus showed that there was significant difference in catch ratio between the Com. and Exp. in 5.0–6.5 cm fyke net on any length classes.
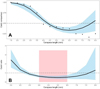 |
Fig. 5 Catch comparison rate (A) and catch ratio (B) of Com.∼Exp. codend for P. leptodactylus. On the upper: the curve (black solid line) represents the modelled catch efficiency fitted to the experimental points (black circles). The blue band represents 95% confidence intervals. The 0.5 dotted horizontal line represents equivalence in catch rates between the two fyke nets. On the bottom: catch ratio curve (black solid line) with 95% confidence intervals (blue band). The 1.0 dotted horizontal line represents the point at which both fyke net have an equal catch rate. Light red areas describe statistical differences in length class. |
Results of catch ratio (CR) (in %) at different lengths and fit statistics for the catch comparison analysis for P. leptodactylus.
4 Discussion
In the current study, which aims to determine the effects of different data sources on BRPs in the context of the data-poor fisheries, it is believed that the commercial catch data obtained entirely from research surveys is consistent with data obtained from fishermen in other studies. In the study conducted by Çapkın et al. (2023) to determine the bycatch rates in crayfish fisheries in Türkiye, the total length ranges of crayfish caught by fishermen were reported as 55.0–156.0 mm, 50.0–153.0 mm, 60.5–151.5 mm and 64.0–145.0 mm in Eğidir Lake, Hirfanlı Dam, Keban Dam and Porsuk Dam, respectively. In this context, it can be stated that the reported total length range is quite similar to our study (50.00–163.38 mm). The current study, which was carried out with 10,680 samples with a total length range of 30.23–163.38 mm, was compared with other studies carried out in relation to P. leptodactylus in terms of number of samples, sampling technique and length range; Bök et al. (2010) used a special fyke net rigged with a smaller mesh size (20 mm) in addition to the commercial fyke net, 2438 crayfish in the range of 33–156 mm TL; Bolat and Kaya (2016) used commercial fyke net in their study and caugth 3008 crayfish in the range of 66–168 mm TL; Büyükçapar et al. (2006) caught 553 crayfish in the TL range 63.09–148.01 mm; Cilbiz (2020) sampled 5920 crayfish with a TL range of 39.34–153.39 mm, using a fyke net rigged with 18 mm mesh size; Demirol et al. (2015) reported the total length range of the caught crayfish in a study using commercial pinter as 109.00–215.00 mm. Considering the results of other studies, it can be said that sampling using only commercial fyke nets results in a narrower length range of crayfish, and the minimum length of caught crayfish is relatively large.
The differences in catch composition between Com. and Exp. fyke nets were evident from statistically significant variations in average total length, length frequency distributions, and catch ratios. The primary factor driving these differences is likely the size selectivity of the fishing gear. Cilbiz et al. (2022) reported that crayfish fyke nets equipped with 34-mm diamond mesh (Com.) exhibit size selectivity and that increasing mesh size raises the average length at 50% retention probability (L50). Given this, the Com. codend—with its larger mesh size—likely permits greater escape of small crayfish compared to the Exp. codend. Consequently, its use may lead to biased representations of the population's true size distribution.
The lower sampling of individuals in the small length class from the Com. codend can be explained by the selectivity of the fyke net. According to Cilbiz et al. (2022), the Com. codend has a length selectivity, even if it is weak. On the other hand, the relatively lower number of individuals in the large length class from the Exp. codend compared to the Com. codend may be more closely related to the behaviour of the prey towards the fishing gear. In general, active fishing gears can catch fish against their will. However, the effectiveness of passive fishing gears, such as pinter, in capturing prey depends on the preferences of the prey, namely its behaviour towards the fishing gear. When evaluated in this context, the lower capture of individuals in the large length class in the Exp. codend may be attributed to the likelihood that these individuals chose not to enter the fyke net (due to the weak selectivity of the Exp. codend with a small mesh size), rather than the possibility that they left after entering the fyke net. Due to their cannibalistic behaviour, large individuals entering the fyke net to feed on the juveniles in the Com. codend (I), small crayfish trying to escape from them (II), or large males attempting to enter the fyke net for mating with females during the breeding period (III) may have caused such a difference in catch composition.
Despite equal fishing effort, variations are observed in the monthly catch numbers in our study. This situation is likely influenced by several factors (I) operational issues (e.g., freezing of the lake surface in January), (II) biological characteristics of the species (e.g., high mobility associated with mating behavior in December, recruitment in April), and (III) fishing pressure (decrease in catch quantity towards the fishing season in September and October).
In the previous LWR studies of P. leptodactylus, b values were reported as 2.64336 (Harlioglu, 1999), 2.8433 (Bolat, 2001), 2.850 (Balık et al., 2005), 3.224 (Bök et al., 2010), 2.7918 (Bolat & Kaya, 2016), and 3.215 (Korkmaz et al., 2023). The b value, considering the entire sample, was found to be 3.150 in the current study. The differences in the reported b values for the same species in previous studies are thought to be attributed to the applied sampling technique, sampling period (monthly or seasonal), and other species-specific biological characteristics (such as female/male ratio, extremity lost, presence of pleopodal egg, soft or hard shell etc…). For successful sampling in crayfish, fishing should be spread throughout the year. Especially during the breeding season, females carrying pleopodal eggs under their abdomen increase the total weight (TW), leading to an increase in the b value. Olusoji et al. (2010) reported that differences in the parameters of length-weight relationships across seasons and years can be influenced by factors such as temperature, salinity, food (quantity and quality), sex, and maturity stage. Capturing crayfish during the moulting period when their shells have not yet hardened sufficiently may result in the TW being below the expected value, leading to a lower b value. Another factor that could affect the LWR parameters in crayfish is the loss of extremities. These lost extremities, often due to intraspecific competition or diseases, can lead to the crayfish's TW being measured lower than normal. Cilbiz (2010), reports that the claw meat yield of male individuals in especially larger length classes is almost equal to the abdominal meat yield. Regarding the sampling technique, it is reported that using of gill net with same mesh size in fishing trial can lead to errors in computing of b value (Froese, 2006; Kipling, 1962). On the other hand, LWR in fishes can be affected by habitat, area, seasonal effect, degree of stomach fullness, gonad maturation, sex, health, and variances in observed length ranges, among others (Tesch, 1971; Barua et al., 2023). The parameters of the LWR equation “a” and “b” use as input parameters in the computing of yield per recruit analysis. Therefore, accurately determining the LWR parameters is crucial for the successful completion of the stock assessment process.
The total mortality coefficient (Z) showed significant differences according to the sampling group in the study. In the Exp. group, crayfish mostly in the small length class were modelled with a maximum relative age of 4, while in the Com. group where crayfish with larger length classes were caught, the maximum relative ages were modelled as 7. In this case, since the point where the catch curve intersects the X-axis is closer to the origin, the slope of the line is higher, resulting in a higher total mortality coefficient for the Exp. group compared to the Com. codend. Taking into account the estimated Fcurr/Fmax values for the sampling groups, it is computed that in order to reduce fishing mortality to the Fmax level, fishing pressure needs to be reduced by 18.25% based on Com., 50.32% for Exp., and 48.67% for the Comb. group data. While the use of only commercial codend (Com.) in the fishing leads to the conclusion that the stock is relatively better, in the other two scenarios (Exp.–Comb.) where the population is better sampled, the situation appears to be more critical. In other studies, on the P. lepodactylus (Tab. 7), the VBGF parameters L∞ values range from 69.97 to 89.07 mm carapace length, and the K (Brody growth coefficient) value varies between 0.41 and 0.68. The variation is thought to be due to factors such as the sampling period and frequency, technical specifications of the used sampling codend, the feeding status of crayfish, sex ratio of subsample, and the level of fishing pressure applied by commercial fishermen.
The total allowable catch (TAC) amounts to be recommended for the following year are given in Table 8 by adapting the rates of reduction in fishing mortality that should be realised at target SPR 0.40 to the TAC 1000 tonnes applied in the previous fishing period. The extra F applied in the evaluation with data gained from Com. is estimated to be 0.79 and 2.39 in the evaluation with Exp. data. In this framework, there is a very high difference of %56 between the recommended TAC amount. The assessment results with the pooled from Com. and Exp. data can be considered closer to the outcomes obtained from the Exp. codend. The observed differences in these size-based assessments are primarily attributed to variations in the size selectivity of Com. and Exp. codends. In this context, accurate gear selectivity data improves the fitting of population dynamics models, which is essential for assessing population viability and establishing harvest regulations. Studies have demonstrated that incorporating gear selectivity into models reduces bias, particularly when data on larger fish are scarce or sampling methods vary across populations (Mitchell et al., 2019; Li & Wagner, 2019).
Summary result of some stock assessment studies conducted on P. leptodactylus.
Advised TAC scenarios by BRPs.
5 Conclusion
As a result, the failure of the Exp. codend to sampling of individuals in the large length class and the failure of the Com. codend to sampling of small individuals have been clearly determined through both K-S and CC as well as CR analyses. It is thought that relying solely on either the Com. or Exp. codend alone will not accurately represent the crayfish population. Instead, using fyke net with different mesh sizes is considered a more accurate approach for successfully capturing all length classes. In future studies, conducting more comprehensive research to develop a methodology akin to the European standard “Water quality − Sampling of fish with multi-mesh gillnets (DS/EN 14757)” for crayfish sampling with fyke net would be beneficial.
Funding
This work was supported by Research Fund of the Isparta University of Applied Sciences under Grant (number 2021-D1-0133).
Conflicts of interest
The authors declare no competing interests.
Data availability statement
The data used in this study are available from the corresponding author, upon reasonable request.
Author contribution statement
B.K. collected the data. M.C. analysed the data. M.C. and Y. B.t wrote the first draft of the manuscript. M.C., B.K. and Y. B. contributed to manuscript revision, and read and approved the submitted version.
Data accessibility
All data and supplementary materials are available from the corresponding author upon request.
Ethics approval
The authors declare all research to be completed in compliance with animal care standards and regulations.
Supplementary Material
Figure 1. Technical plan of a fyke net used for collecting commercial catch data.
Figure 2. Technical plan of a fyke net used for collecting survey data.
Access hereReferences
- Ainsworth RF, Cowx IG, Funge-Smith SJ. 2023. Putting the fish into inland fisheries − a global allocation of historic inland fish catch. Fish Fish 24: 263–278. [CrossRef] [Google Scholar]
- Alam MS, Liu Q, Schneider P, Mozumder MMH, Chowdhury MZR, Uddin MM, Monwar MM, Hoque ME, Barua S. 2022. Length-Based Stock Assessment for the Data-Poor Bombay Duck Fishery from the Northern Bay of Bengal Coast, Bangladesh. J Mar Sci Eng 10: 213. [CrossRef] [Google Scholar]
- Aydın CM, Tıraşın EM. 2023. Information on the deep-water giant red shrimp Aristaeomorpha foliacea (Risso, 1827) (Crustacea, Decapoda, Aristeidae) population in Antalya Bay (Eastern Mediterranean Sea, South of Turkey) based on the MEDITS protocol. Reg Stud Mar Sc 60: 102885. [Google Scholar]
- Balık İ, Çubuk H, Özkök R, Uysal R. 2005. Some Biological Characteristics of Crayfish (Astacus leptodactylus Eschscholtz, 1823) in Lake Eğirdir. Turk J Zool 29: 295–300. [Google Scholar]
- Barua S, Liu Q, Alam MS, Schneider P, Mozumder MMH, Rouf MA. 2023. Population dynamics and stock assessment of two major eels (Muraenesox bagio and Congresox talabonoides) from the marine waters of Bangladesh. Front Mar Sci 10. https://doi.org/10.3389/fmars.2023.1134343 [CrossRef] [Google Scholar]
- Berber S, Mazlum Y, Demirci A, Türel S. 2012. Structure, growth, mortality and size at sexual maturity of various populations Astacus leptodactylus Eschscholtz, 1823 (Cructecea: Decopada) in Turkey. Mar Sci Tec Bul 1: 21–27. [Google Scholar]
- Bolat, Y. 2001. The population size estimating of crayfih (Astacus leptodactylus Esch., 1823) in Hoyran Area of Eğirdir Lake [in Turkish] Süleyman Demirel University, Graduate School of Natural and Applied Sciences. Phd. Thesis 117p. [Google Scholar]
- Bolat Y, Kaya MA. 2016. Determination of growth and reproduction properties of freshwater crayfish (Astacus leptodactylus, Eschscholtz, 1823) in Eğirdir Lake-Türkiye [in Turkish]. Eğirdir Su Ürünleri Fakültesi Dergisi 12: 11–24. [Google Scholar]
- Bök TD, Harlioǧlu MM, Deval MC. 2010. A study on the morphometric characteristics of Astacus leptodactylus inhabiting the Thrace region of Turkey. Knowl Manag Aquat Ecosyst 397: kmae 100011. [Google Scholar]
- Branch TA, Jensen OP, Ricard D, Ye Y, Hilborn R. 2011. Contrasting global trends in marine fishery status obtained from catches and from stock assessments. Conserv Biol 25: 777–786. [CrossRef] [PubMed] [Google Scholar]
- Büyükçapar HM, Alp A, Kaya M, Çiçek Y. 2006. The length-weight relationships, and meat yield of crayfish (Astacus leptodactylus Eschscholtz, 1823) in the Mamasın Reservoir (Aksaray, Turkey)[in Turkish]. E.U. J Fish Aquat Sci 23: 21–25. [Google Scholar]
- Cerbule K, Jacques N, Pettersen H, Ingólfsson ÓA, Herrmann B, Grimaldo E, Larsen RB, Brinkhof J, Sistiaga M, Lilleng D, Brčić J. 2021. Bycatch reduction in the deep-water shrimp (Pandalus borealis) trawl fishery with a large mesh top panel. J Nat Conserv 61: 126001. [CrossRef] [Google Scholar]
- Chong L, Mildenberger TK, Rudd MB, Taylor MH, Cope JM, Branch TA, Wolff M, Stäbler M. 2019. Performance evaluation of data-limited, length-based stock assessment methods. ICES J Mar Sci 77: 97–108. [Google Scholar]
- Cilbiz, N. 2010). Determination of carotenoid amount, meat yield and chemical composition on freshwater crayfish (Astacus leptodactylus, Esch. 1823) in Eğirdir Lake (Isparta-Turkey) [in Turkish]. Süleyman Demirel University, Graduate School of Natural and Applied Sciences. MSc Thesis. 41p. [Google Scholar]
- Cilbiz M. 2020. Pleopodal fecundity of narrow-clawed crayfish (Pontastacus leptodactylus Eschscholtz, 1823. Invertebr Reprod Dev 64: 208–218. [CrossRef] [Google Scholar]
- Cilbiz M, Aydin C, Herrmann B. 2022. New codend designs to improve the size selectivity of fyke net for narrow-clawed crayfish (Pontastacus leptodactylus) Aquat Living Resour 35: 14. [Google Scholar]
- Cilbiz M, Uysal R. 2023. Stock Assessment of Atherina Boyeri Risso, 1810 using two different methodological approaches (length-based VPA and Catch-only CMSY), in a Freshwater Ecosystem. Thalassas Int J Mar Sci 32: 1015–1025. [CrossRef] [Google Scholar]
- Coates D. 2023. Ecosystem restoration and inland food fisheries in developing countries-opportunities for the United Nations Decade on Ecosystem Restoration 2021–2030). (FAO Fisheries and Aquaculture Circular No. 1231 Rome, FAO, Issue. [Google Scholar]
- Cooke SJ, Allison EH, Beard TD Jr, Arlinghaus R, Arthington AH, Bartley DM, Cowx IG, Fuentevilla C, Leonard NJ, Lorenzen K, Lynch AJ, Nguyen VM, Youn SJ, Taylor WW, Welcomme RL. 2016. On the sustainability of inland fisheries: Finding a future for the forgotten. Ambio 45: 753–764. [CrossRef] [PubMed] [Google Scholar]
- Costello C, Ovando D, Hilborn R, Gaines SD, Deschenes O, Lester SE. 2012. Status and solutions for the world's unassessed fisheries. Science 338: 517–520. [Google Scholar]
- Çapkın K, Cilbiz M, Demirol F. 2023. Bycatch estimation of narrow-clawed crayfish (Pontastacus leptodactylus) in Turkish fyke net fisheries. Fish Manage Ecol 30: 171–181. [CrossRef] [Google Scholar]
- Da N, Ouedraogo R, Oueda A. 2023. Growth, and Stock Status Assessment of African Catfish, Clarias anguillaris (Linnaeus, 1758) from Burkina Faso Newly Man-Made Lake Samandeni. Adv Biosci Biotechnol 14: 346–357. [CrossRef] [Google Scholar]
- Dağtekin M. 2023. The invasive mollusk Rapana venosa (Mollusca: Neogastropoda: Muricidae) in the mid-southern Black Sea: distribution, growth, and stock structure. Acta Ichthyol Piscat 53: 191. [CrossRef] [Google Scholar]
- de Mutsert K, Cowan JH, Essington TE, & Hilborn R. 2008. Reanalyses of Gulf of Mexico fisheries data: landings can be misleading in assessments of fisheries and fisheries ecosystems. PNAS 105: 2740–2744. [CrossRef] [PubMed] [Google Scholar]
- Demirol F, Gunduz F, Yuksel F, Coban MZ, Beri A, Kurtoğlu M, Yıldırım T, Kucukyilmaz M. 2015. The investigation of by-catch and discard rates in crayfish (Astacus leptodactylus Eschscholtz, 1823) catching in the Keban Dam Lake. Limnofish 1: 69–74. [CrossRef] [Google Scholar]
- Deval MC, Bök T, Ateş C, Tosunoǧlu Z. 2007. Length-based estimates of growth parameters, mortality rates, and recruitment of Astacus leptodactylus (Eschscholtz, 1823) (Decapoda, Astacidae) in unexploited inland waters of the northern Marmara region, European Turkey). Crustaceana 80: 655–665. [CrossRef] [Google Scholar]
- Dowling NA, Dichmont CM, Haddon M, Smith DC, Smith ADM, Sainsbury K. 2015. Empirical harvest strategies for data-poor fisheries: a review of the literature. Fish Res 171: 141–153. [CrossRef] [Google Scholar]
- Dutta S, Al-Jufaili S, Al-Anbouri IS, Paul S. 2023. Population status of Sardinella longiceps of the sultanate of Oman: perspectives of length-based approach. Thalassas: Int J Mar Sci https://doi.org/10.1007/s41208-023-00627-5 [Google Scholar]
- Efron B. (1982. The Jackknife, the Bootstrap and Other Resampling Plans. CBMS-NSF Regional Conference Series in Applied Mathematics, Monograph 38, SIAM, Philadelphia. https://doi.org/http://dx.doi.org/10.1137/1.9781611970319 [Google Scholar]
- Ersönmez H, Özyurt, CE, Mavruk S, Yıldız T, Ulman A. 2023. An in-depth study of the biology, trophic ecology and catchability of the invasive pufferfish Lagocephalus sceleratus from southern Turkey, eastern Mediterranean Sea. Sci Mar 87: e075. [CrossRef] [Google Scholar]
- European Standard EN 14757. 2005. Water Quality—Sampling of Fish with Multimesh Gillnets. CEN TC 230, March 2005. [Google Scholar]
- Fakıoğlu YE, Gökçe G, Özbilgin H, Cerbule K, Herrmann B. 2023. Impact of ground gear design on catch efficiency in demersal trawl fishery. Reg Stud Mar Sci 61: 102852. [Google Scholar]
- Fitzgerald CJ, Droll JS, Shephard S, Monk CT, Rittweg T, Arlinghaus R. 2023. Length-based assessment of an exploited coastal pike (Esox lucius) stock (Rügen, southern Baltic Sea) underscores the crucial relevance of growth and natural mortality for assessment outcomes. Fish Res 263: 106667. [CrossRef] [Google Scholar]
- Froese R. 2006. Cube law, condition factor and weight-length relationships: history, meta-analysis and recommendations. J Appl Ichthyol 22: 241–253. [Google Scholar]
- Funge-Smith SJ. 2018. Review of the state of world fishery resources: inland fisheries. FAO Fisheries and Aquaculture Circular No. C942 Rev.3, Rome, FAO. 397 pp. [Google Scholar]
- Goodyear CP. 1993. Spawning stock biomass per recruit in fisheries management: foundation and current use. In Smith SJ, Hunt JJ, Rivard, D (Eds.), Risk evaluation and biological reference points for fisheries management. Canadian special publication of fisheries and aquatic sciences. 120 (pp. 67–82). [Google Scholar]
- Harlioglu MM. 1999. The relationships between length-weight, and meat yield of freshwater crayfish, Astacus leptodactylus eschscholtz, in the Agin Region of Keban Dam Lake. Turk J Zool 23: 949–957. [Google Scholar]
- Hashemi SA, Doustdar M, Derakhsh PM, Muhammad AA. 2024. Length-Based Fishery Status of Indian White Prawn (Penaeus Indicus, Milne-Edwards, 1837) in the Northern Waters of the Oman Sea (Iran). Thalassas 40: 1611–1620. [CrossRef] [Google Scholar]
- Herrmann B, Sistiaga M, Santos J, Sala A. 2016. How many fish need to be measured to effectively evaluate trawl selectivity? PLOS ONE 11: e0161512. [CrossRef] [PubMed] [Google Scholar]
- Herrmann B, Sistiaga MB, Nielsen KN, Larsen RB. 2012. Understanding the size selectivity of redfish ( Sebastes spp.) in North Atlantic Trawl Codends. J Northwest Atl Fish Sci 44: 1–13. [CrossRef] [Google Scholar]
- Hordyk A, Ono K, Sainsbury K, Loneragan N, Prince J. 2015. Some explorations of the life history ratios to describe length composition, spawning-per-recruit, and the spawning potential ratio. ICES J Mar Sci 72: 204–216. [CrossRef] [Google Scholar]
- Jin S, Jiao Y, Li J, Xu Z, Xu Y, Zou M, Ding J, Li X, Wang Z, Wang M, Li W, Zhang T, Lek S, Zhu M, Luo S. 2024. Length-based stock assessment for Procambarus clarkii aquaculture management in China: an alarming of ongoing recruitment overfishing. Aquaculture 579: 740182. [CrossRef] [Google Scholar]
- Jones R. 1984. Assessing the effects of changes in exploitation pattern using length composition data (with notes on VPA and cohort analysis). FAO Fish.Tech.Pap., (No:256): 118p. [Google Scholar]
- Kassambara A. 2023. _rstatix: Pipe-Friendly Framework for Basic Statistical Tests_. R package version 0.7.2, https://CRAN.R-project.org/package=rstatix. [Google Scholar]
- Kilada R, Acuña E. 2015. Direct age determination by growth band counts of three commercially important crustacean species in Chile. Fisheries Res 170: 134–143. [CrossRef] [Google Scholar]
- Kindong R, Sarr O, Wu F, Tian S. 2022. Length-based assessment methods for the conservation of a Pelagic Shark, Carcharhinus falciformis from the tropical pacific ocean. Fishes 7: 184. [CrossRef] [Google Scholar]
- Kipling C. 1962. The use of the scales of the Brown Trout (Salmo trutta L.) for the Back-Calculation of Growth. ICES J Mar Sci 27: 304–315. [CrossRef] [Google Scholar]
- Kleiven AR, Espeland SH, Stiansen S, Ono K, Zimmermann F, Olsen EM. 2022. Technological creep masks continued decline in a lobster (Homarus gammarus) fishery over a century. Sci Rep 12: 3318. [CrossRef] [PubMed] [Google Scholar]
- Korkmaz B, Bolat Y, Cilbiz M. 2023. Length-based Stock Assessment for the Data-poor Crayfish Fishery from the Eğirdir Lake, Turkiye. Turk J Fish Aquat Sci 23: TRJFAS22354. [Google Scholar]
- Li Y, Wagner T. 2019. Does incorporating gear selectivity during macroscale investigations of fish growth reduce size-selective sampling bias in parameter estimates? Can J Fish Aquat Sci 76: 2089–2101. [CrossRef] [Google Scholar]
- Lomeli MJM, Groth SD, Blume MTO, Herrmann B, Wakefield WW. 2020. The efficacy of illumination to reduce bycatch of eulachon and groundfishes before trawl capture in the eastern North Pacific ocean shrimp fishery. Can J Fish Aquat Sci 77: 44–54. [CrossRef] [Google Scholar]
- Lomeli MJM, Wakefield WW, Herrmann B, Dykstra CL, Simeon A, Rudy DM, Planas JV. 2021. Use of artificial illumination to reduce Pacific halibut bycatch in a U.S. West Coast groundfish Bottom trawl. Fish Res, 233: 105737. [CrossRef] [Google Scholar]
- Mei W, Yu G, Greenwell B. 2022. _ggtrendline: Add Trendline and Confidence Interval to 'ggplot'_. R package version 1.0.3, https://github.com/PhDMeiwp/ggtrendline. [Google Scholar]
- Methot RD, Wetzel CR. 2013. Stock synthesis: a biological and statistical framework for fish stock assessment and fishery management. Fish Res 142: 86–99. [CrossRef] [Google Scholar]
- Mildenberger TK, Taylor MH, Wolff M. 2017. TropFishR: an R package for fisheries analysis with length-frequency data. Methods Ecol Evol 8: 1520–1527. [CrossRef] [Google Scholar]
- Mitchell L, Newman K, Baxter R. 2019. Estimating the size selectivity of fishing trawls for a short-lived fish species. San Francisco Estuary Watershed Sci 17. https://doi.org/10.15447/sfews.2019v17iss1art5 [CrossRef] [Google Scholar]
- Miranda LE, Funk HG, Palmieri M, Stafford JD, Nichols ME. 2024. Length in assessing status of freshwater fish populations: a review. North Am J Fish Manag 44: 1092–1110. [CrossRef] [Google Scholar]
- Moutopoulos DK, Koutsikos N, Vardakas L, Perdikaris C. 2022. A history of Greek inland fishery development during 1928–2019. Fish Manage Ecol 29: 681–692. [CrossRef] [Google Scholar]
- Nelson GA. 2023. _fishmethods: Fishery Science Methods and Models_. R package version 1.12-1, https://CRAN.R-project.org/package=fishmethods [Google Scholar]
- Olusoji O, Anifowose O, Sodamola M. 2010. Length-weight relationships, condition factor and fecundity of the West Africa Freshwater Crab, Sudanonautes africanus (Milne-Edwards 1883), in Western Nigeria. West Afr J Appl Ecol 16 (1). https://doi.org/10.4314/wajae.v16i1.55869 [Google Scholar]
- Ovando D, Free CM, Jensen OP, Hilborn R. 2022. A history and evaluation of catch-only stock assessment models. Fish Fish 23: 616–630. [CrossRef] [Google Scholar]
- Özseven A, Akkurt I, Günoğlu K. 2020. Determination of some dosimetric parameters in Eğirdir Lake, Isparta, Turkey. Int J Environ Sci Technol1 7: 1503–1510. [CrossRef] [Google Scholar]
- Pauly D. 1984. Fish population dynamics in tropical water: a manual for use with programmable calculators. ICLARM Studies and Reviews 8, 325 p. International Center for Living Aquatic Resources Management, Manila, Philippines., 325. [Google Scholar]
- Pauly D. 1990. Length-converted catch curves and the seasonal growth of fishes. Fishbyte 8: 33–38. [Google Scholar]
- Pauly D, David N. 1981. ELEFAN I, a BASIC program for the objective extraction of growth parameters from length-frequency data. Meeresforschung 28: 205–211. [Google Scholar]
- Pauly D, Moreau J, Abad N. 1995. Comparison of age-structured and length-converted catch curves of brown trout Salmo trutta in two French rivers. Fish Res 22: 197–204. [CrossRef] [Google Scholar]
- Pauly D, Morgan G eds. 1987. Length-based methods in fisheries research. ICLARM Conference Proceedings 13, 468 p. International Center for Living Aquatic Resources Management, Manila, Philippines, and Kuwait Institute for Scientific Research, Safat, Kuwait (Vol. 13) WorldFish. [Google Scholar]
- Pilling GM, Apostolaki P, Failler P, Floros C, Large PA, Morales-Nin B, Reglero P, Stergiou KI, Tsikliras AC. 2009. Assessment and management of data-poor fisheries. In A. Payne, J. Cotter, T. Pojder (Eds.), Advancesin fisheries science: 50 Years on From Beverton and Holt. (Vol. 50, pp. 280–305). Wiley. [Google Scholar]
- Pons M, Cope JM, Kell LT. 2020. Comparing performance of catch-based and length-based stock assessment methods in data-limited fisheries. Can J Fish Aquat Sci 77: 1026–1037. [CrossRef] [Google Scholar]
- Raza H, Liu Q, Alam MS, Han Y. 2022. Length based stock assessment of five fish species from the Marine Water of Pakistan. Sustainability 14: 1587. [CrossRef] [Google Scholar]
- RStudioTeam. 2023. RStudio: Integrated Development for R. RStudio, PBC, Boston, MA Retrieved from: https://posit.co/download/rstudio-desktop/. [Google Scholar]
- Reis-Filho JA, Ramos-Filho F, Castello L, Giarrizzo T. 2023. I fish, therefore I monitor: Participatory monitoring to assess inland small-scale fisheries. Environ Manage 72: 540–557. [CrossRef] [PubMed] [Google Scholar]
- Santos L, Vasconcelos-Filho J, Eduardo LN, Lira A, Craveiro C, Silva EF, Lucena-Frédou F. 2023. Stock assessment of Larimus breviceps, a bycatch species exploited by artisanal beach seining in Northeast Brazil. Fish Manage Ecol 31: e126471–10. [Google Scholar]
- Sarr O, Kindong R, Sow FN, Tian S. 2023. Estimation of Atlantic bonito (Sarda sarda) stock status in the Senegalese Exclusive Economic Zone (SEEZ) from the catch-based model (CMSY) and length-based bayesian estimation (LBB) method. Reg Stud Mar Sci 65: 103052. [Google Scholar]
- Scanu M, Froglia C, Grati F, Bolognini L. 2024. Estimate of Growth Parameters of Penaeus kerathurus (Forskäl, 1775) (Crustacea, Penaeidae) in the Northern Adriatic Sea. Animals 14: 1068. [CrossRef] [PubMed] [Google Scholar]
- Scrucca L. 2013. GA: a package for genetic algorithms in R. J Stat Softw 53: 1–37. [CrossRef] [Google Scholar]
- Somers IF. 1988. On a seasonally oscillating growth function. ICLARM Fishbyte 6: 8–11. [Google Scholar]
- Suresh VR, Varghese E, Sajina AM, Karna SK, Mohanty SK, Sethi PK, Mukherjee M, Banik SK, Jayaraman J, Munivenkatappa MH, Mukherjee J, Manna RK, Panda D. 2023. Assessment of data-limited fisheries: A case study of three finfish species in Chilika lagoon, India. Fish Manage Ecol 30: 182–202. [CrossRef] [Google Scholar]
- Şener E, Varol S, Şener Ş, Davraz A. 2019. Assessment of the stream network pollution in the Eğirdir Lake Basin (Turkey) using water quality index and multivariate analysis. J Eng Sci Des 7: 352–368. [Google Scholar]
- Taylor MH, Mildenberger TK. 2017. Extending electronic length frequency analysis in R. Fish Manage Ecol 24: 330–338. [CrossRef] [Google Scholar]
- Tesch FW. 1971. “Age and growth,” in Methods for assessment offish productionin fresh waters. Ed. Ricker (Oxford: Blackwell Scientific Publications), 99–130. [Google Scholar]
- Tesfaye M, Tesfaye G, Getahun A. 2021. Growth and status of Nile tilapia (Oreochromis niloticus L.) stock in Lake Chamo, Ethiopia. Lakes Reserv 26: e12375. [CrossRef] [Google Scholar]
- Then AY, Hoenig JM, Hall NG, Hewitt DA. 2015. Evaluating the predictive performance of empirical estimators of natural mortality rate using information on over 200 fish species. ICES J Mar Sci 72: 82–92. [CrossRef] [Google Scholar]
- Thompson WF, Bell FH. 1934. Biological statistics of the Pacific halibut fishery. (2) Effect of changes in intensity upon total yield and yield per unit of gear. International Fisheries Commission, Report No. 8 49 pp. [Google Scholar]
- Walters C, Maguire JJ. 1996. Lessons for stock assessment from the northern cod collapse. Rev Fish Biol Fish 6: 125–137. [Google Scholar]
- Wang K, Zhang C, Xu B, Xue Y, Ren Y. 2020. Selecting optimal bin size to account for growth variability in Electronic LEngth Frequency ANalysis (ELEFAN). Fish Res 225: 105474. [CrossRef] [Google Scholar]
- Wickham H. 2016. ggplot2: Elegant Graphics for Data Analysis. Springer-Verlag New York. [Google Scholar]
- Xiang Y, Gubian S, Suomela B, Hoeng J. 2013. Generalized simulated annealing for efficient global optimization: the GenSA package for R. The R Journal 5: 13–28. [Google Scholar]
Cite this article as: Cilbiz M, Korkmaz B, Bolat Y. 2025. Commercial vs. survey data in length-based stock assessment: insights from Turkish crayfish fisheries. Aquat. Living Resour. 38: 10. https://doi.org/10.1051/alr/2025008
All Tables
Monthly carapace length distribution (mm) of P. leptodactylus by sampling codend.
Results of the K-S test used to compare length frequency distributions between pairs of codends.
von Bertalenffy Growth Function (VBGF) parameters of P. leptodactylus by caught codend groups.
The impact of alterations in fishing mortality on the BRP of P. leptodactylus by sampled fyke nets.
Results of catch ratio (CR) (in %) at different lengths and fit statistics for the catch comparison analysis for P. leptodactylus.
All Figures
|
Fig. 1 Maps show global location of Eğirdir Lake and distribution of the 10 sampling stations on the lake. |
| In the text | |
|
Fig. 2 General view of combined experimental fyke nets on the lake bottom. |
| In the text | |
|
Fig. 3 Length frequency distribution of P. leptodactylus by codend type and sampling month (The dashed green horizontal line represents MCRS). |
| In the text | |
|
Fig. 4 Length-frequency histograms with the fitted growth curves (A: Commercial catch data B: Experimental catch data C: Combined Data). |
| In the text | |
|
Fig. 5 Catch comparison rate (A) and catch ratio (B) of Com.∼Exp. codend for P. leptodactylus. On the upper: the curve (black solid line) represents the modelled catch efficiency fitted to the experimental points (black circles). The blue band represents 95% confidence intervals. The 0.5 dotted horizontal line represents equivalence in catch rates between the two fyke nets. On the bottom: catch ratio curve (black solid line) with 95% confidence intervals (blue band). The 1.0 dotted horizontal line represents the point at which both fyke net have an equal catch rate. Light red areas describe statistical differences in length class. |
| In the text | |
Current usage metrics show cumulative count of Article Views (full-text article views including HTML views, PDF and ePub downloads, according to the available data) and Abstracts Views on Vision4Press platform.
Data correspond to usage on the plateform after 2015. The current usage metrics is available 48-96 hours after online publication and is updated daily on week days.
Initial download of the metrics may take a while.